Market and Competitor Analysis
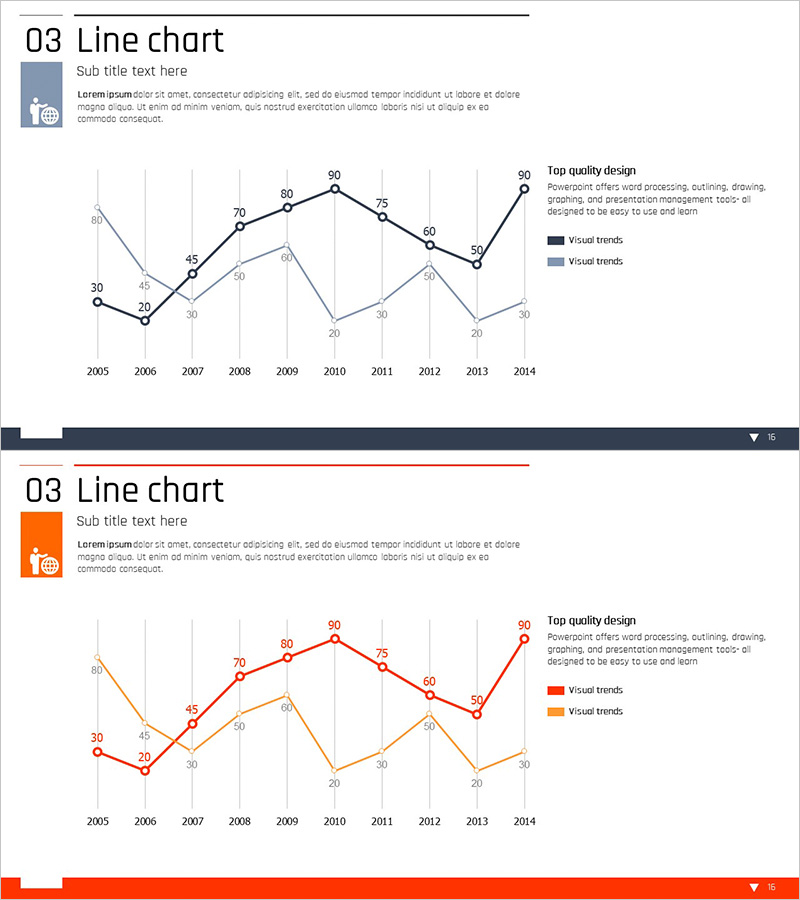
Competitor Comparison Broken Line Graph – Essential Tool for Market Analysis
RJ0300038_16
- Last Update 12/21/2025
- File Size 0.1MB
- # of Slides 2
- File Format PPTX
- Slide Ratio 16:9
- Color
Keywords
About the Product
This slide features a broken line graph for competitor comparison, visually analyzing the performance of market players. The overall design conveys a modern and sophisticated feel, harmonizing navy and orange for an intuitive and accessible experience. Ideal for market and competitor analysis reports or business presentations, it effectively delivers business insights quickly. Replaceable elements include text and data sheets, with an editing difficulty rated as 'easy', allowing anyone to modify and use it effortlessly.
Related Products
-
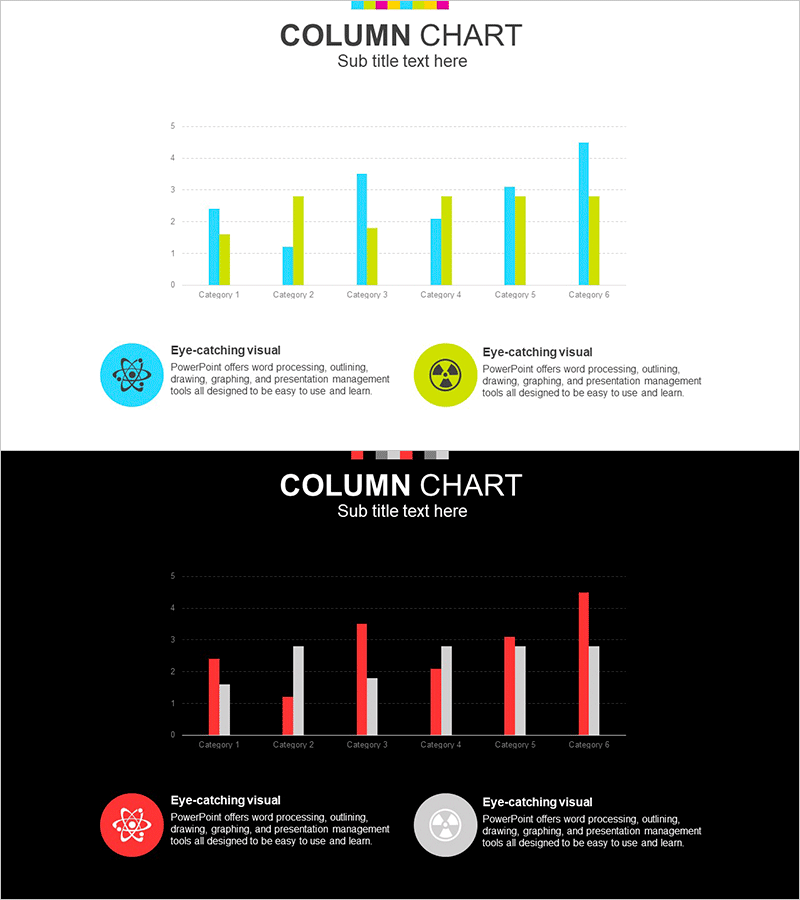
Chemical Experiment Vertical Bar Graph - Data Visualization and Analysis
#Market and Competitor Analysis #Graph #Competitor Analysis
-
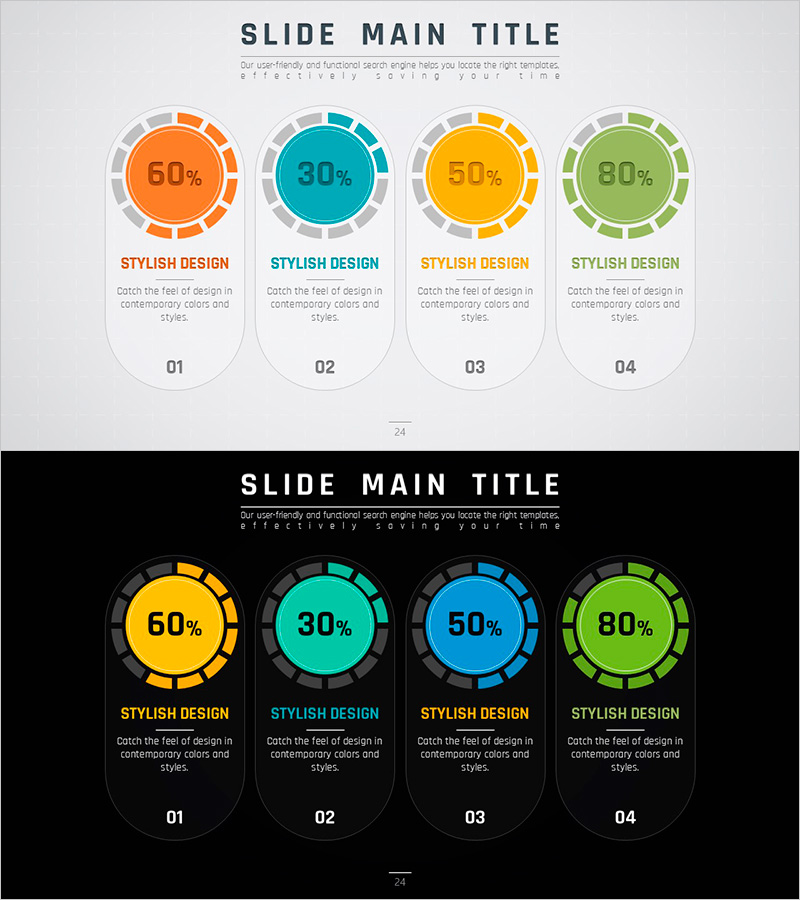
Visualizing Key Achievements with Donut Chart Slide – Company and Product/Service Introduction
#Company Introduction #Product/Service #Diagram
-
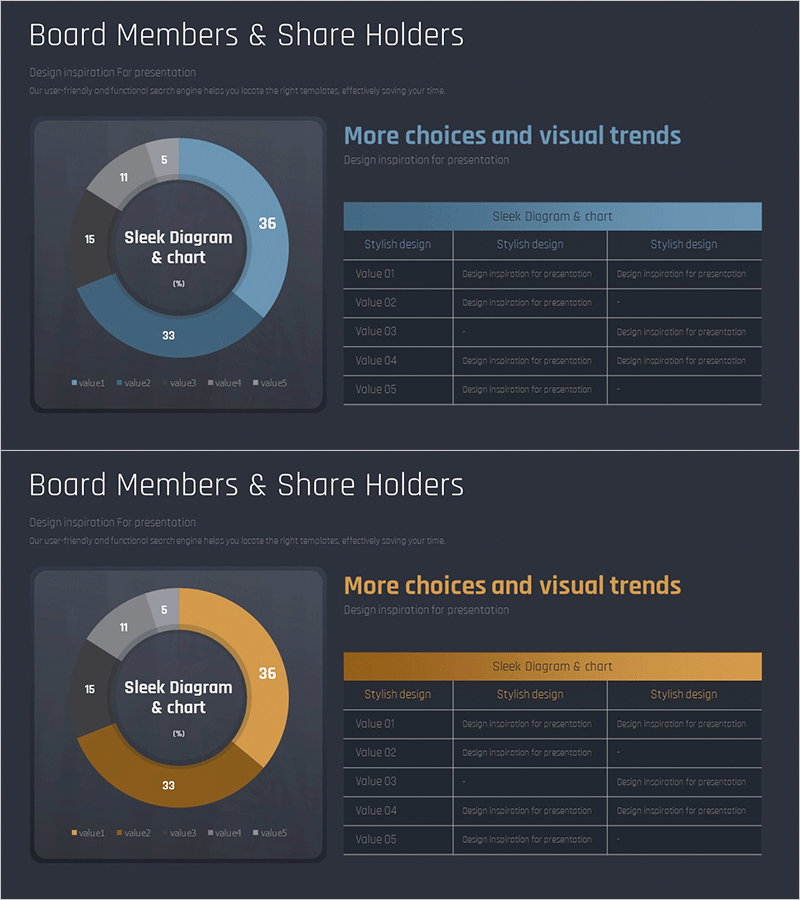
Visualizing Board Members and Shareholders with a Sleek Diagram
#Company Introduction #Market and Competitor Analysis #Diagram
-

Kids and Learning Infographics – Creative Learning Tools
#Market and Competitor Analysis #Diagram #Customer Analysis
