Market and Competitor Analysis
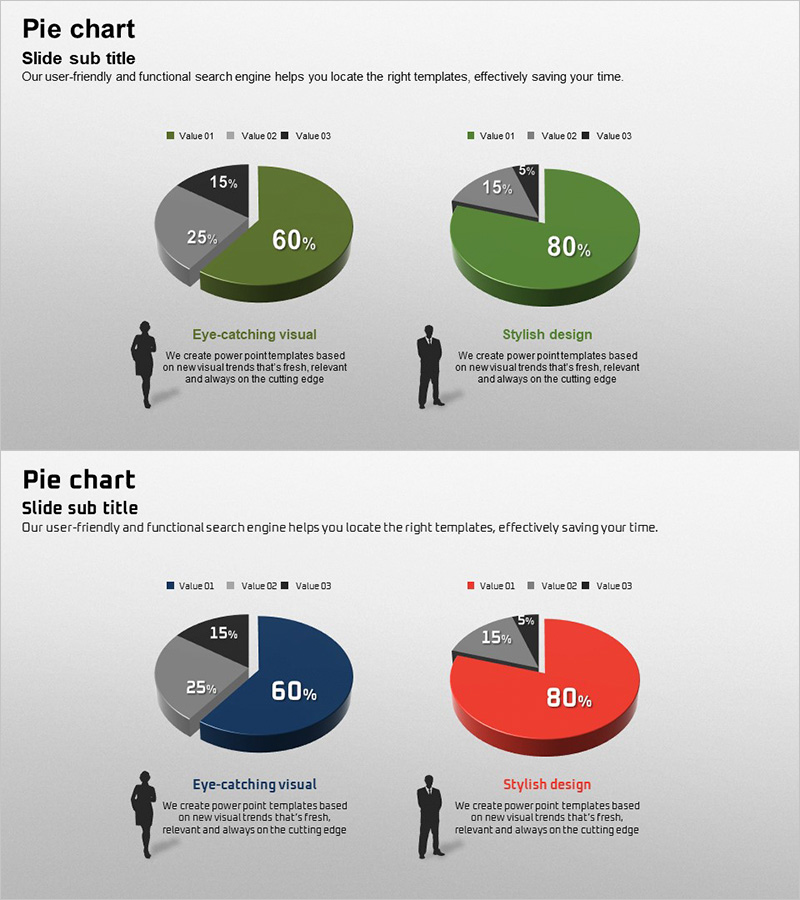
Gender Ratio Customer Analysis 3D Circle Graph – Insights for Market Understanding
RJ0300036_16
- Last Update 12/21/2025
- File Size 1.2MB
- # of Slides 2
- File Format PPTX
- Slide Ratio 16:9
- Color
Keywords
About the Product
This slide utilizes a 3D circle graph to visualize gender ratios tailored for customer segmentation, effectively aiding customer analysis. The three-dimensional design of the pie chart offers intuitive insights into market dynamics, enhanced by a color palette of green, orange, and red for diverse perspectives. This slide is particularly useful for gender-based customer segmentation and marketing strategy development, significantly raising the presentation's attention with its striking visuals. Text and graph elements are easy to replace, with an editing difficulty rated as moderate, allowing for quick updates with the latest data.
Related Products
-
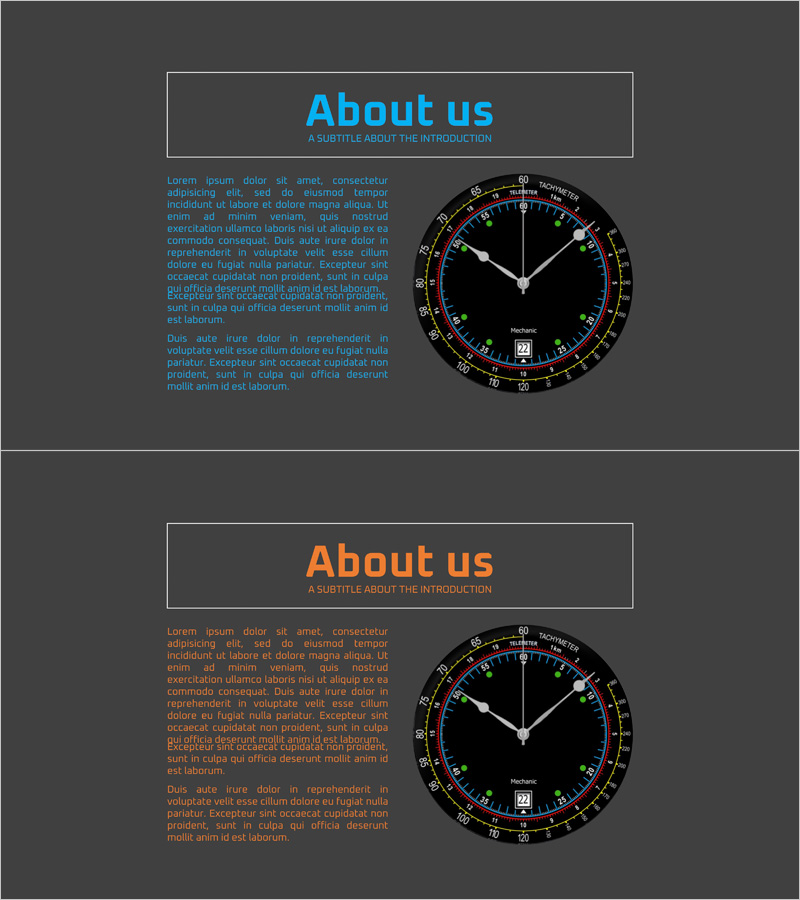
Smartwatch Product and Developer Overview – Fusion of Innovation and Technology
#Company Introduction #Product/Service #Other
-
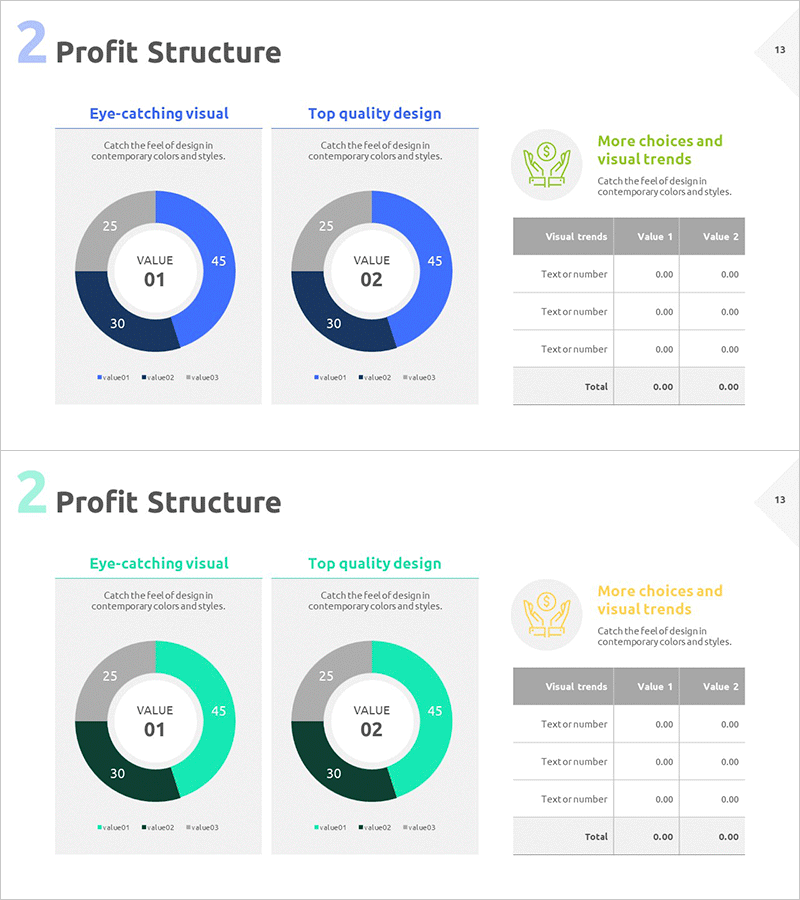
Profit Structure Analysis Donut Chart
#Product/Service #Business Introduction #Diagram
-
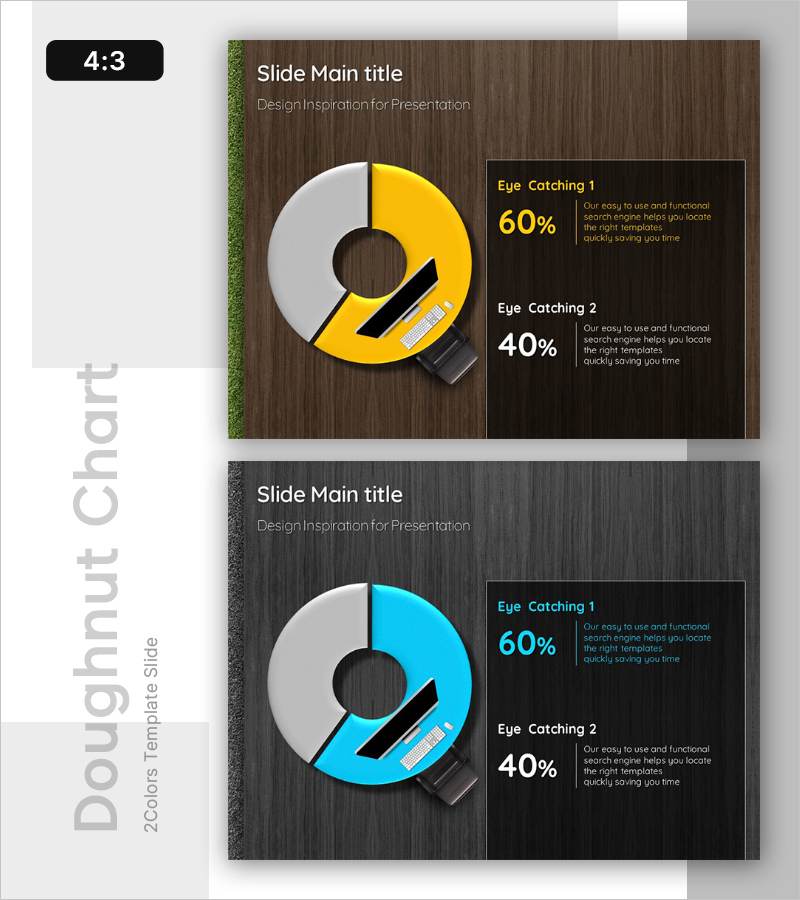
Office Desk Donut Chart Analysis – Visualizing Market Share
#Market and Competitor Analysis #Graph #Market Status
-
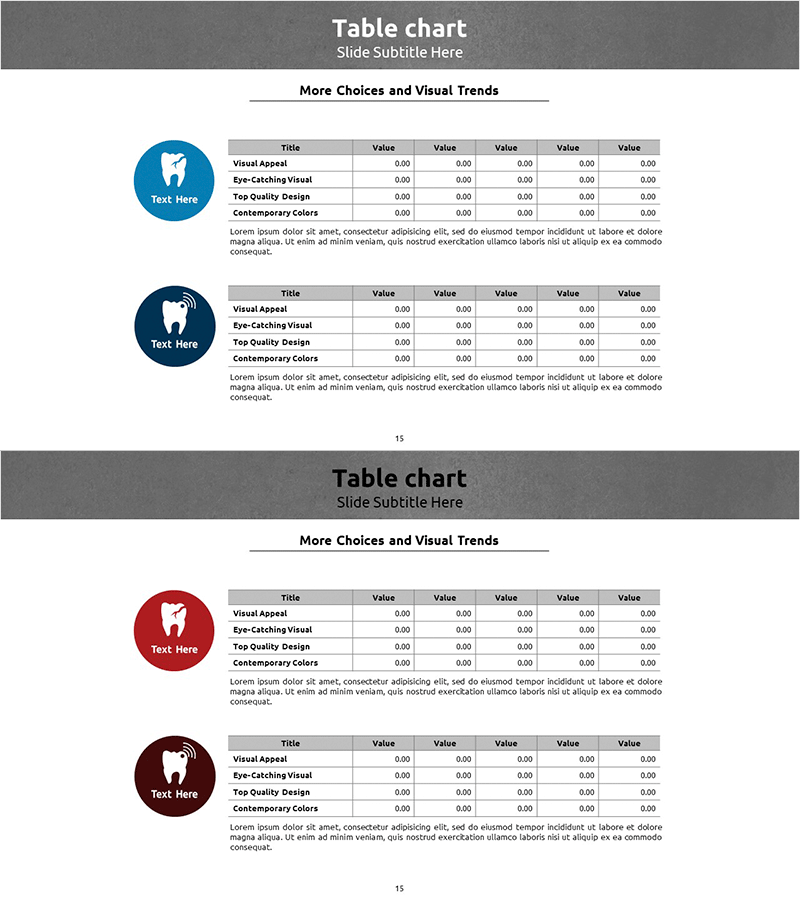
Tooth Decay Analysis Table Slide – Market and Competitor Analysis
#Market and Competitor Analysis #Diagram #Competitor Analysis
