Product/Service
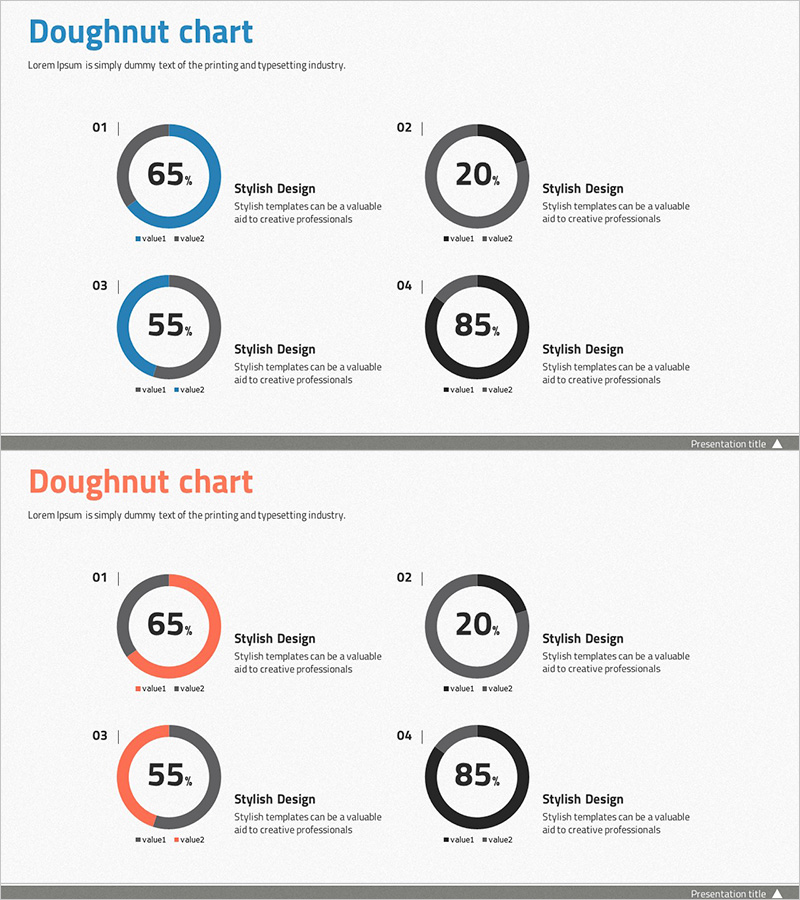
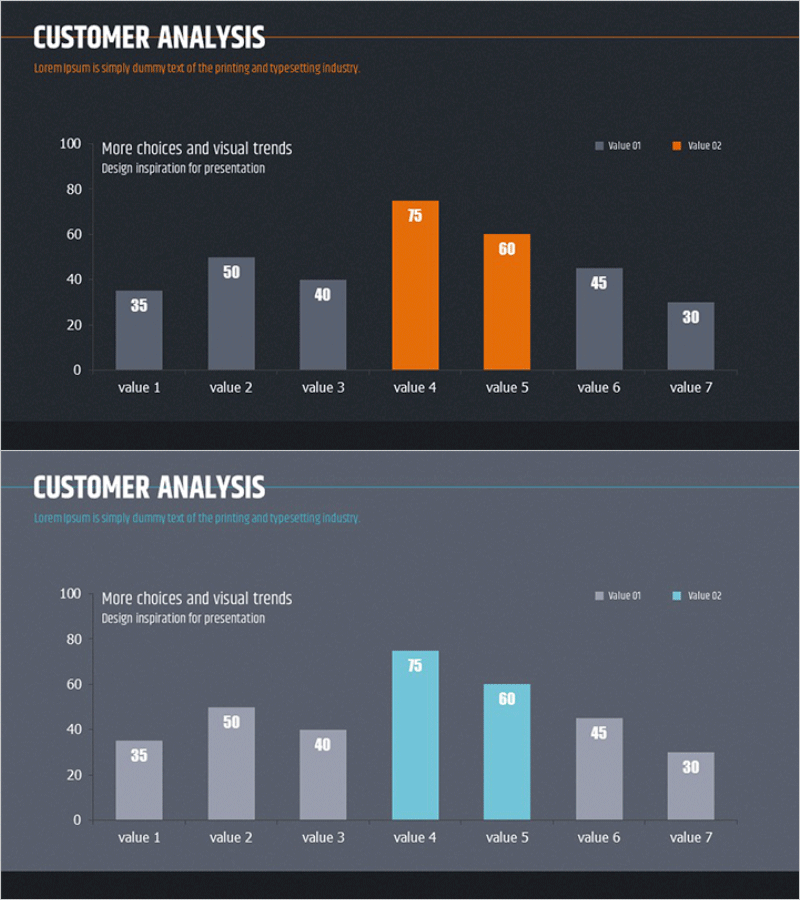
Graph of Development Status by Field – Visualizing Achievements
RJ0300034_6
- Last Update 12/21/2025
- File Size 5.6MB
- # of Slides 2
- File Format PPTX
- Slide Ratio 16:9
- Color
Keywords
About the Product
This slide features a doughnut chart template designed to visualize the development status across different fields. It provides a clear and intuitive analysis of the proportions in each sector with a clean layout, effectively helping in market and competitive analysis as well as product/service introductions. The use of blue and red colors ensures that each data point is easily discernible. This template is suitable for various presentation contexts and has a medium editing difficulty, allowing for straightforward replacement of text and data.
Related Products
-
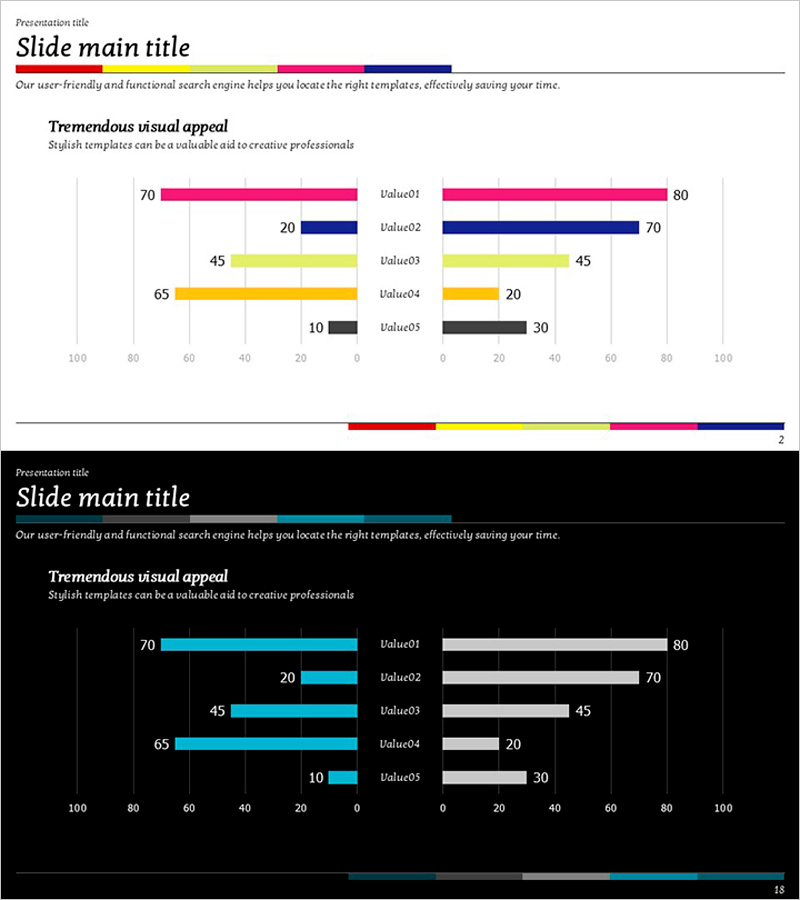
Consumption Status Comparison Chart – Essence of Market Analysis
#Market and Competitor Analysis #Graph #Competitive Advantage
-
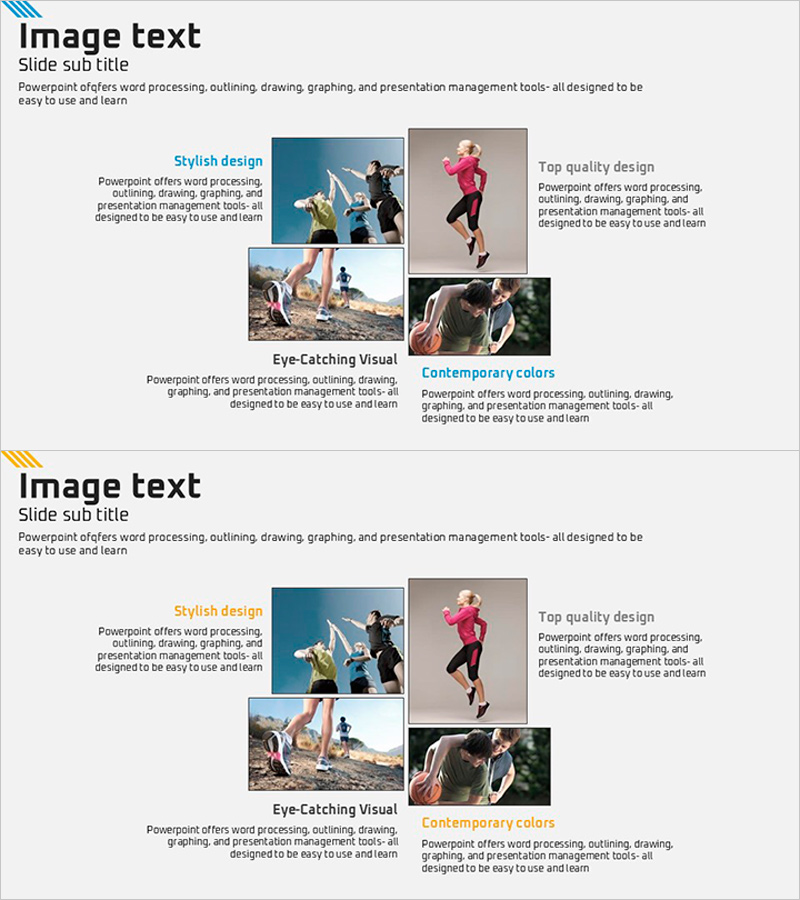
Introduction to Sport Activities – Growth through Participation
#Product/Service #Diagram #Program Introduction
-
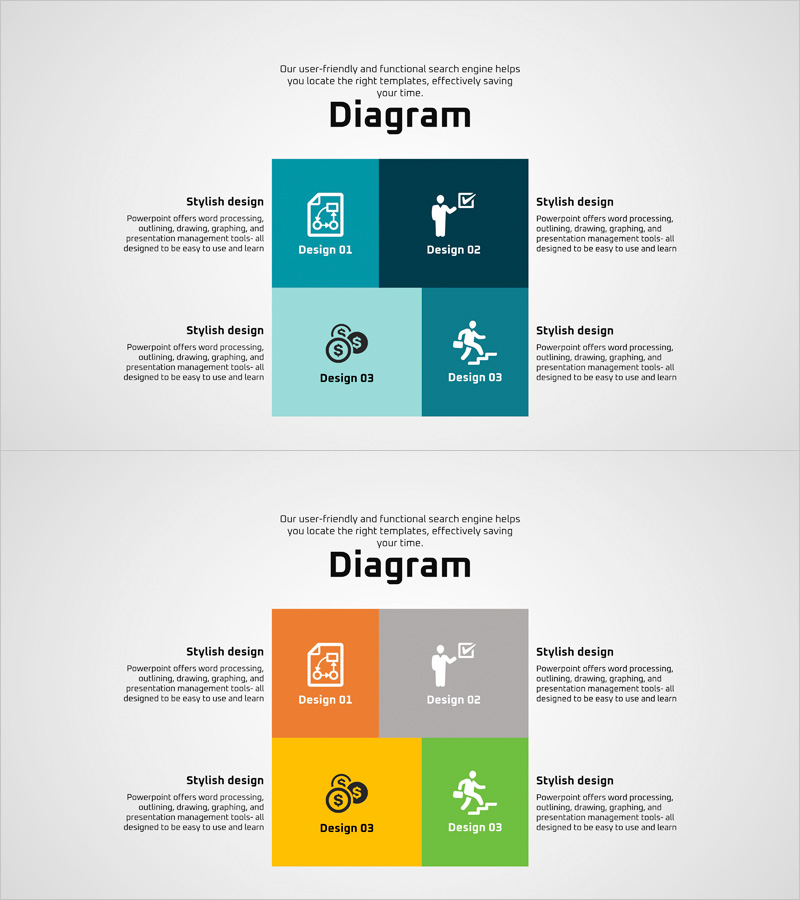
Marketing and Service Differentiation Strategy – Efficient Information Delivery
#Product/Service #Marketing Plan and Strategy #Diagram
-
User Market Analysis Graph
#Market and Competitor Analysis #Graph #Market Analysis
