Business Goal Setting Diagram – Vision and Strategy
RJ0300026_21
- Last Update 04/24/2025
- File Size 1.5MB
- # of Slides 2
- File Format PPTX
- Slide Ratio 16:9
- Color
Keywords
- #Content-Based Slides
- #Design-Based Slides
- #Business Vision and Strategy
- #Business Strategy
- #Diagram
- #Business Goals
- #Step-by-Step Schedule Plan
- #Cluster
- #Chain Diagram
- #16:9
- #5-step diagram PowerPoint
- #connected diagram slide
- #business goal setting template
- #phased process diagram
- #vision strategy PowerPoint slide
- #how to create process diagram in PowerPoint
About the Product
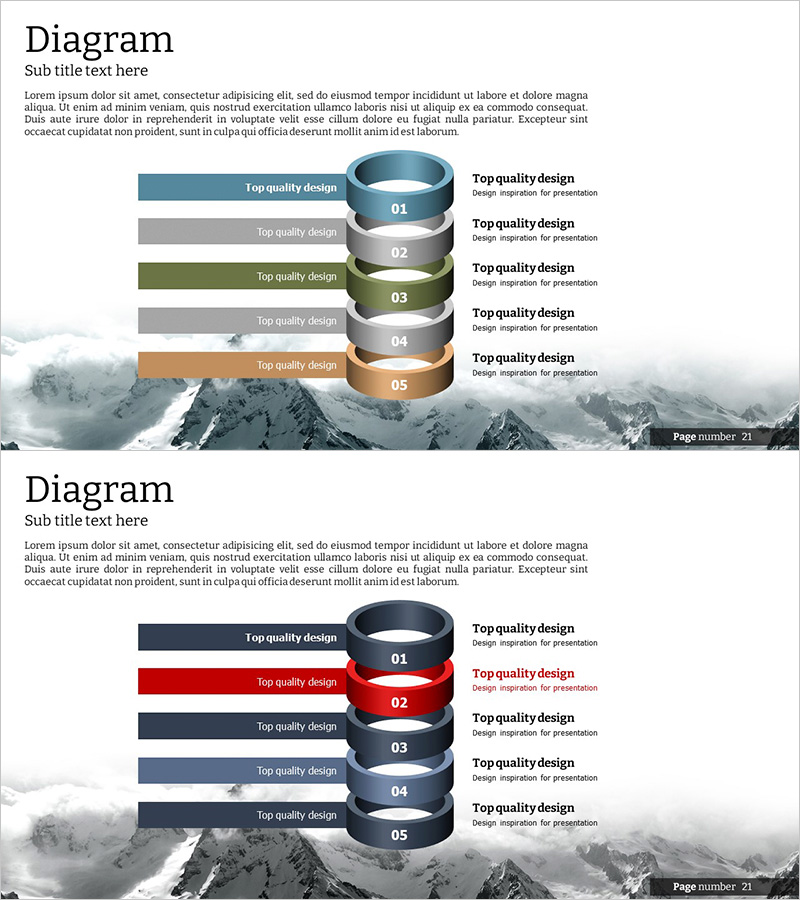
A 5-step connected diagram PowerPoint slide that visualizes business objectives and strategic vision in sequential stages. Provided in two color versions (blue, green, and tan tones / navy, red, and gray tones), each stage features a colored bar on the left linked to a text area on the right, enabling clear expression of strategy development, goal achievement pathways, and phased business planning. Optimized for 16:9 widescreen in PPTX format with full editing capability, ideal for presentations, reports, and strategic proposals to emphasize key messages.
Usage Points
-
Main Usage
Designed to visually represent business goal setting, vision establishment, and phased strategic planning, with each stage supported by descriptive text. The linked structure between colored bars and text areas clearly communicates stage-to-stage relationships and progression.
-
How to Use
Click each stage's colored bar to modify background and text colors, then enter goal descriptions, strategic initiatives, or implementation plans in the right text area. Select the color version that best matches your presentation theme and corporate identity.
-
Recommended For
Ideal for executives, planning teams, and strategy managers presenting business plans, conducting strategic planning meetings, pitching to investors, or sharing annual objectives. Particularly effective when emphasizing five sequential phases or progressive business initiatives.
-
Slide Structure
Two-slide set with five connected nodes (stages) per slide. Left side displays colored bars (blue, gray, green, gray, tan or navy, red, gray, blue, gray), right side contains text input areas for each stage, with connecting lines between nodes representing stage continuity and progression.
Related Products
-

Step-by-step Plans and Key Messages – Business Strategy Diagram
#Business Vision and Strategy #Business Strategy #Diagram
-

Space Theme Schedule Diagram – Achieving Business Goals and Strategies
#Business Vision and Strategy #Business Strategy #Diagram
-

Fashion Business Planning and Target Strategy – Diagram Utilization
#Business Vision and Strategy #Business Strategy #Diagram
-

Surgical Drape Theme Connection Diagram - Expressing Business Goals and Strategies
#Business Vision and Strategy #Business Strategy #Diagram
