Science Experiment Goal Diagram – Effective Strategy Formulation
RJ0400019_17
- Last Update 05/22/2025
- File Size 0.8MB
- # of Slides 2
- File Format PPTX
- Slide Ratio 16:9
- Color
Keywords
- #Content-Based Slides
- #Design-Based Slides
- #Business Introduction
- #Business Vision and Strategy
- #Business Strategy
- #Diagram
- #Business Goals
- #Step-by-Step Schedule Plan
- #Cluster
- #Chain Diagram
- #16:9
- #diamond diagram PowerPoint
- #connection diagram slide template
- #4-step strategy flow
- #goal flowchart PPT
- #business strategy diagram slide
About the Product
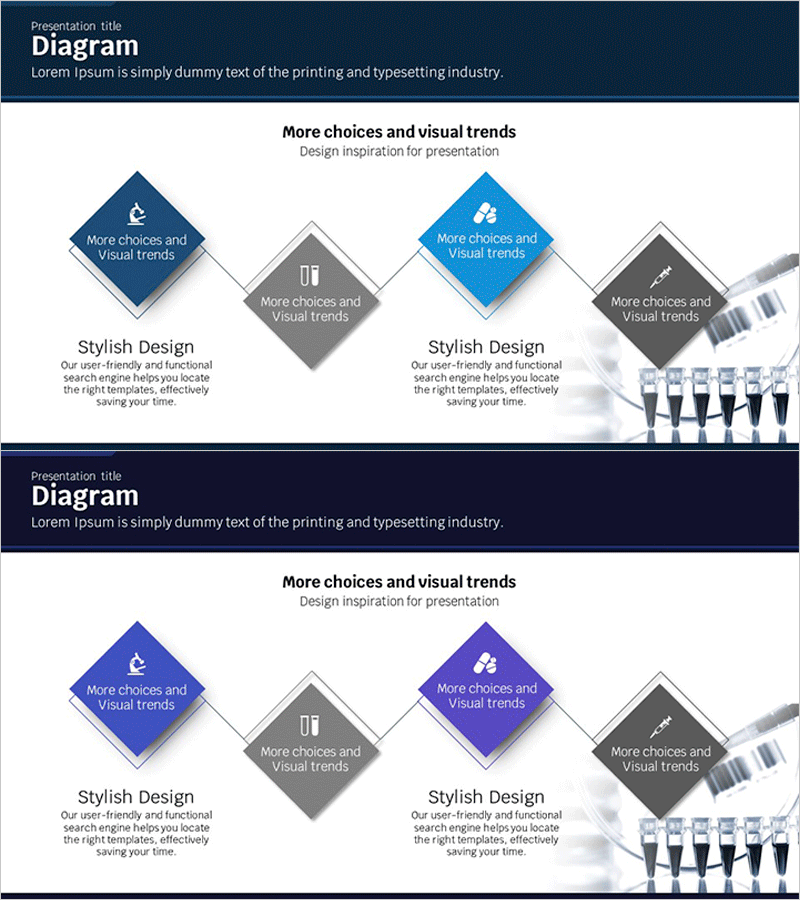
A PowerPoint slide featuring diamond-shaped nodes connected by lines to visualize a step-by-step strategy flow. Four nodes are arranged in left-right symmetry using dark blue, light blue, and gray color schemes, with icon and text areas in each node. This slide deck is ideal for business goal setting, strategy explanation, and process flow visualization in presentations, business plans, and reports. Effectively communicates key messages through visual hierarchy. 2-slide set, 16:9 aspect ratio, PPTX format.
Usage Points
-
Main Usage
Represents business goal-setting stages, strategic execution processes, and phased implementation plans using diamond nodes and connecting lines. Delivers logical flow to audiences through visual structure. Icon and text areas in each node emphasize stage-specific content and key messages.
-
How to Use
Input stage goals, strategies, and action items into the four symmetrically arranged nodes. Customize by changing icons or adjusting colors to match your presentation theme. Insert into business plans, strategy reports, or proposals to explain complex processes intuitively and maintain audience engagement.
-
Recommended For
Executives, planning teams, marketing departments, and project managers explaining business strategy, goal achievement paths, and phased execution plans. Suitable for investor pitch decks, business plans, strategy reports, and organizational restructuring presentations where decision-making processes need visual clarity.
-
Slide Structure
Four diamond-shaped nodes arranged in left-right symmetry, each colored distinctly: dark blue (node 1), gray (node 2), light blue (node 3), and dark gray (node 4). Each node contains icon and text input areas. Connecting lines between nodes indicate process flow. Bottom section includes 'Stylish Design' descriptive text area for additional context.
Related Products
-

Transportation Business Overview – Infographic Slide for Vision and Strategy
#Business Introduction #Business Vision and Strategy #Diagram
-

Service Overview and Goals Green Navy Presentation Template
#Business Introduction #Business Vision and Strategy #Diagram
-

Fashion Business Planning and Target Strategy – Diagram Utilization
#Business Vision and Strategy #Business Strategy #Diagram
-

Planet Illustration Plan Diagram – Connecting Vision and Steps with Cluster
#Business Vision and Strategy #Business Strategy #Diagram
