Car Wheel Configuration Diagram - Visual Representation
RJ0300025_12
- Last Update 04/24/2025
- File Size 0.1MB
- # of Slides 2
- File Format PPTX
- Slide Ratio 16:9
- Color
Keywords
About the Product
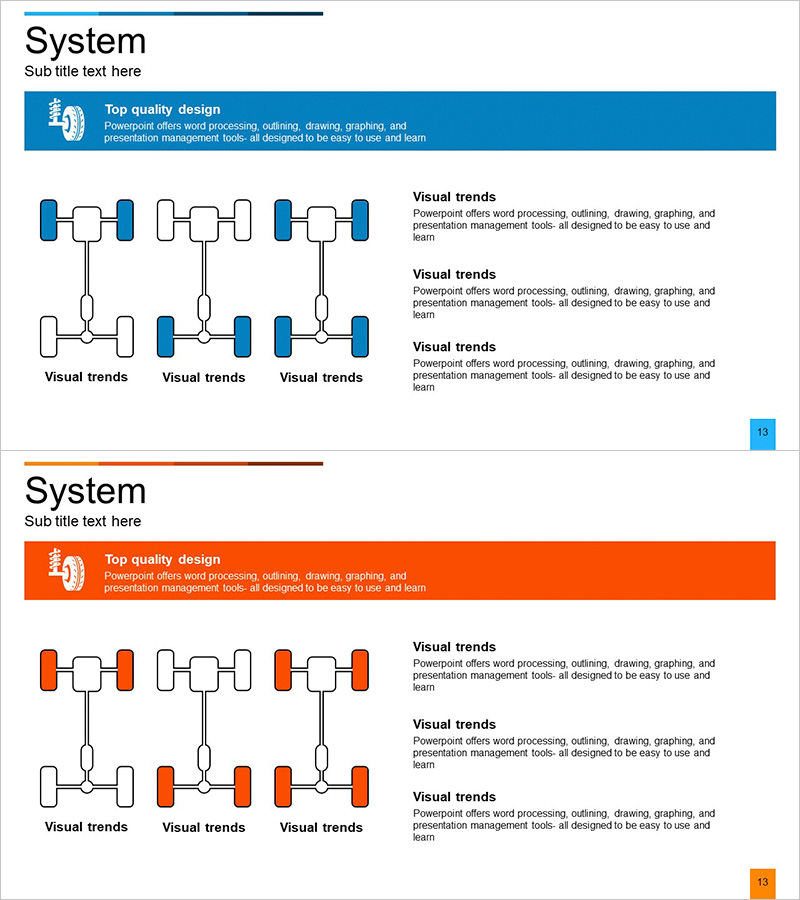
A 2-slide PowerPoint presentation that visualizes complex technical system structures through a hierarchical flow diagram. The design uses a dual-tone color scheme of blue and orange, with a central hub expanding into a network structure on both sides. Each node features editable text areas, making it ideal for explaining service architecture, system infrastructure, and technology frameworks. Provided in 16:9 widescreen PPTX format, this slide set effectively communicates intricate technical systems in product presentations, system proposals, and technology briefings.
Usage Points
-
Main Usage
Simplifies complex technical system structures into a clear hierarchical flow format. The central hub expanding into a network structure effectively illustrates service components, system architecture, and technology infrastructure relationships in an intuitive visual manner.
-
How to Use
Insert into the technology or architecture section of product presentations, system proposals, or technical briefings. Edit each node's text area to include system components, service names, or technology stack elements. Adjust colors to differentiate layers or functional groups, and use the right-side description area to detail each component's role and functionality.
-
Recommended For
Ideal for technology teams, development departments, and IT professionals presenting system explanations. Effectively communicates technical infrastructure reliability and structural completeness to investors, partners, and clients. Suitable for microservices architecture, cloud infrastructure, and system design presentations.
-
Slide Structure
2-slide set with each slide featuring a left-side hierarchical flow diagram (3 levels × 3-4 nodes per level) and a right-side text description area. Both blue and orange color variants are provided for flexible document styling and brand alignment.
Related Products
-

Drone Main System Configuration Diagram – Visualization of Innovation
#Product/Service Introduction #Technical Approach #Diagram
-

SEO System Configuration Diagram – Technology Sector Strategy
#Business Vision and Strategy #Technical Approach #Diagram
-

Blood Pressure Measurement Comparison Diagram
#Technical Approach #System Architecture Diagram
-

IoT Service Configuration Diagram – Visual Explanation for Technology Sector
#Product/Service Introduction #Technical Approach #Diagram
