Step-by-step Work Plan Diagram – Strategic Implementation Structure
RJ0300024_11
- Last Update 04/24/2025
- File Size 0.3MB
- # of Slides 2
- File Format PPTX
- Slide Ratio 16:9
- Color
Keywords
- #Content-Based Slides
- #Design-Based Slides
- #Product/Service Introduction
- #Business Strategy
- #Diagram
- #Features
- #Step-by-Step Schedule Plan
- #Cluster
- #Chain Diagram
- #16:9
- #linear diagram PowerPoint
- #5-step flow slide
- #work plan presentation template
- #project timeline diagram PPT
- #infographic slide design
About the Product
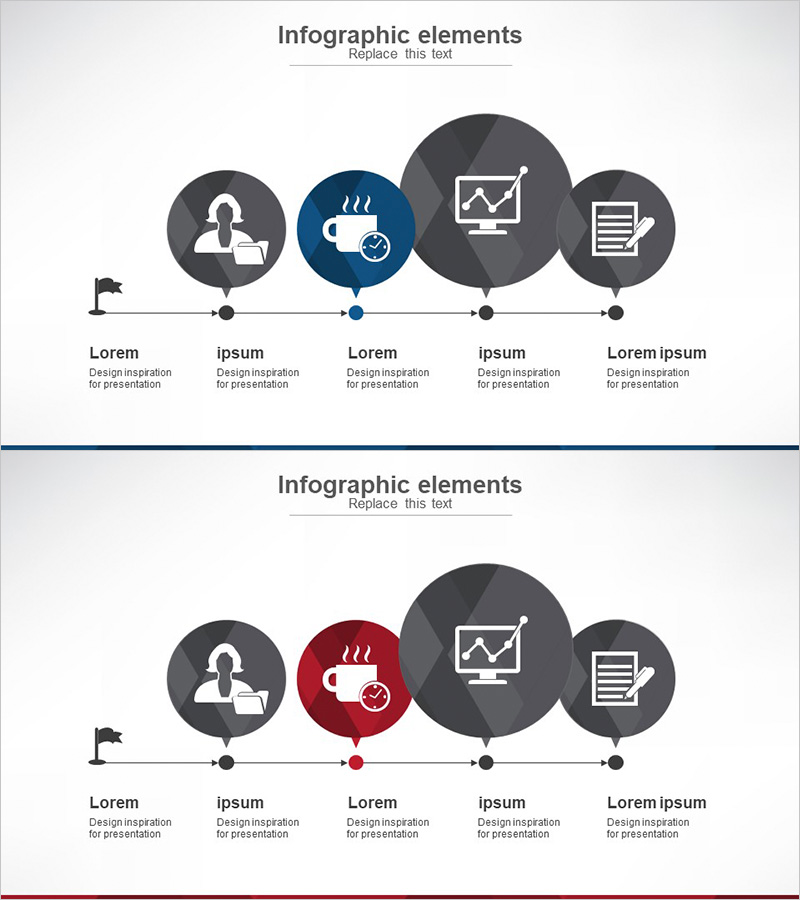
A 5-step linear connection diagram PowerPoint slide that visualizes project implementation phases. The horizontal flow structure starts with a flag icon and connects five circular nodes, each featuring step icons (people, coffee, chart, document) and text areas. Dark gray nodes with accent colors (navy blue, wine red) highlight critical stages. This infographic slide is ready to use for work plan presentations, strategic implementation roadmaps, and project timeline management in PowerPoint.
Usage Points
-
Main Usage
Visualizes project and work plan phases in a clear, sequential manner. The linear flow from start flag through five stages helps audiences understand the complete timeline and role of each phase at a glance.
-
How to Use
Enter phase names, owners, and timelines in each circular node. Customize icons to match your business context and use accent colors (navy or wine red) to emphasize critical stages. Add detailed descriptions in text areas for presentation delivery.
-
Recommended For
Project managers, strategy planners, and marketing professionals presenting business timelines, campaign phases, or product development roadmaps. Ideal for executive briefings, team meetings, and client proposal presentations requiring clear phase-by-phase explanations.
-
Slide Structure
Two-slide set: standard version with five dark gray nodes and emphasis version with center node highlighted in navy blue or wine red. Each slide features a flag start point, horizontal connector line, five circular nodes with icons, and editable text areas, optimized for 16:9 widescreen format.
Related Products
-

Step-by-step Business Process Diagram – Effective Business Strategy
#Product/Service Introduction #Business Strategy #Diagram
-

Cluster Connectivity Plan Diagram – Essential Tool for Business Strategy
#Product/Service Introduction #Business Strategy #Diagram
-

Car Maintenance Service Process – Visualized Step-by-Step Flow
#Product/Service Introduction #Business Strategy #Diagram
-

Galaxy Theme Attribute Connection Diagram – Engaging Business Development
#Product/Service Introduction #Business Strategy #Diagram
