City Business Sector Diagram – Modern Business Approach
RJ0300021_5
- Last Update 04/23/2025
- File Size 5.6MB
- # of Slides 2
- File Format PPTX
- Slide Ratio 16:9
- Color
Keywords
- #Content-Based Slides
- #Design-Based Slides
- #Company Introduction
- #Product/Service Introduction
- #Diagram
- #Business Areas
- #Composition
- #Cluster
- #Chain Diagram
- #16:9
- #city business sector diagram PowerPoint
- #area chart slide template
- #connected diagram presentation
- #business region visualization
- #how to create sector diagram in PowerPoint
- #area map slide download
About the Product
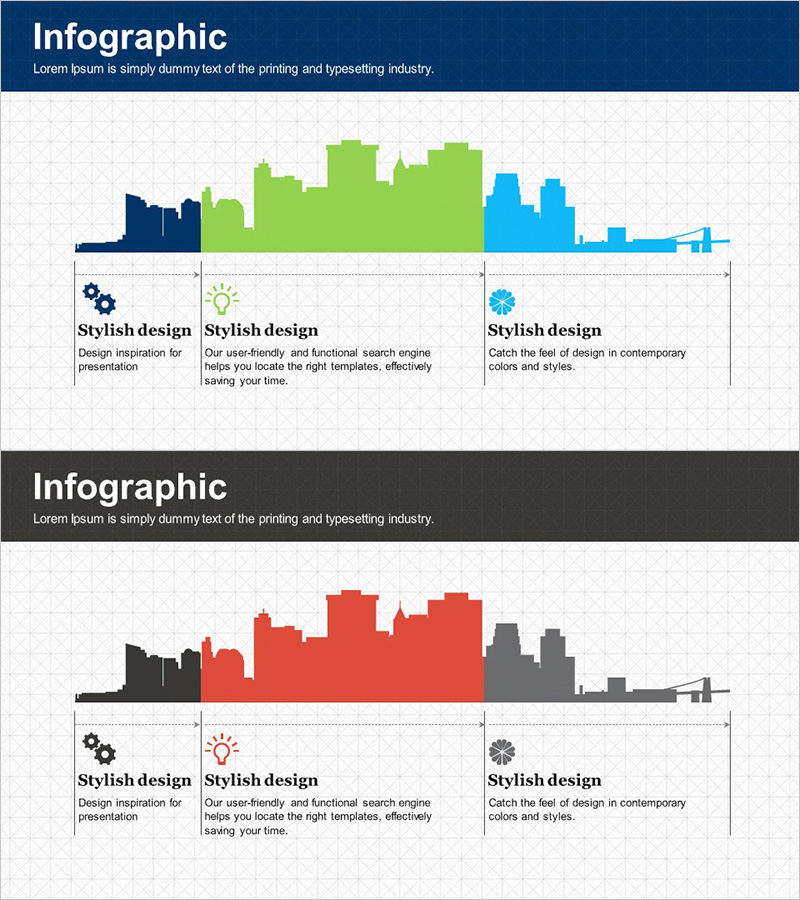
A connected-area diagram PowerPoint slide that visualizes urban business sectors and regional industries. Three distinct color zones—dark blue, lime green, and sky blue—represent different business areas while showing their relative scale and interconnections. This 16:9 widescreen 2-slide set is ready to use for business sector analysis, market entry strategy, organizational structure presentations, and regional economic overviews. Each area includes editable text fields for custom data input, making it ideal for strategy, market analysis, and business introduction sections in corporate presentations.
Usage Points
-
Main Usage
Visualizes urban or regional business sectors, industries, and their relative scale in a hierarchical, interconnected format. Ideal for presenting business portfolios, market analysis, organizational structures, and data-driven strategic decisions to stakeholders.
-
How to Use
Enter sector names, revenue figures, employee counts, or other metrics into each color-coded area. Use slide 1 as an overview map and slide 2 for detailed explanations, creating a logical flow from summary to specifics during your presentation.
-
Recommended For
Recommended for executives, business development teams, marketing professionals, urban planners, and investors. Suitable for new business venture reports, regional economic analysis, corporate portfolio presentations, and urban development project proposals.
-
Slide Structure
Slide 1 features a connected-area map with three distinct zones (dark blue, lime green, sky blue), each with independent text input boxes. Area sizes, colors, and positions are fully customizable. Slide 2 provides a detailed explanation layout with additional space for sector-specific data, statistics, and descriptive text for each region.
Related Products
-

Triangular Connection Structure Diagram – Visual Representation of Business Connections
#Company Introduction #Product/Service Introduction #Diagram
-

Service Composition Diagram Circular Diagram – Clustering and Connection
#Product/Service Introduction #Technical Approach #Diagram
-

Diagram Slide Effectively Showing Car Service Configuration Contents
#Product/Service Introduction #Diagram #Product/Service Introduction
-

Geometric Shape Diagram – Visualizing Business Areas
#Company Introduction #Business Introduction #Diagram
