Triangular Connection Structure Diagram – Visual Representation of Business Connections
RM0100011_17
- Last Update 01/28/2025
- File Size 1MB
- # of Slides 2
- File Format PPTX
- Slide Ratio 16:9
- Color
Keywords
- #Content-Based Slides
- #Design-Based Slides
- #Company Introduction
- #Product/Service Introduction
- #Diagram
- #Business Areas
- #Composition
- #Cluster
- #Chain Diagram
- #16:9
- #triangular diagram PowerPoint
- #connection structure slide template
- #3-node relationship diagram
- #business connection diagram
- #organizational structure PowerPoint slide
About the Product
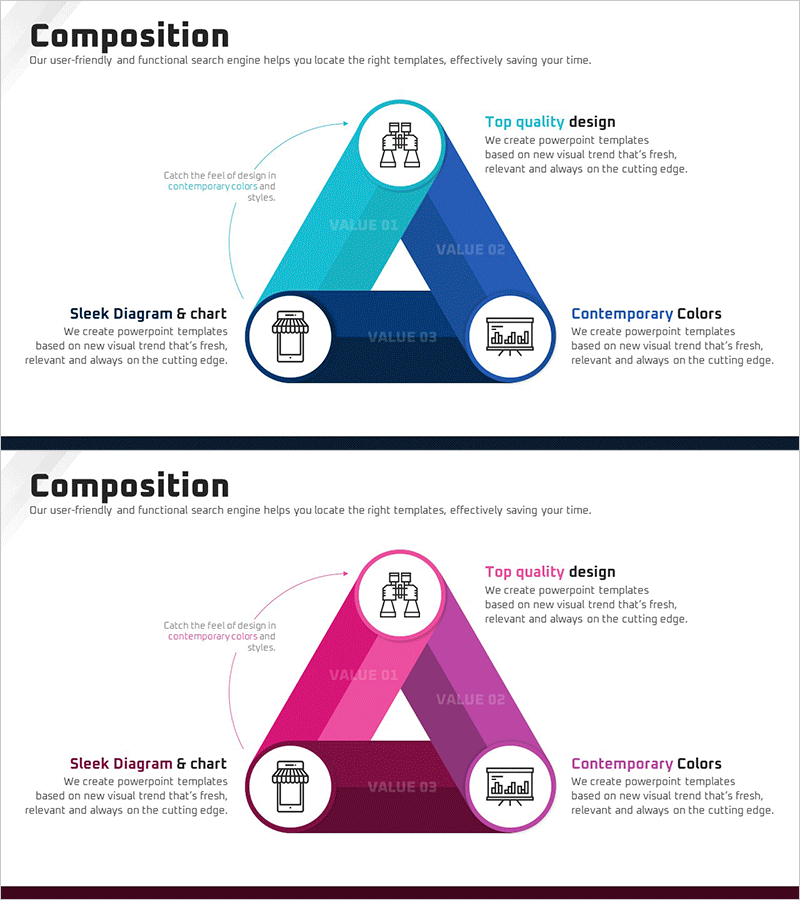
A structural diagram PowerPoint slide that connects three core elements in a triangular layout. Available in two color versions—blue and magenta—with each node featuring icons and text areas. Arrows and connection lines clearly express relationships between elements, enabling visualization of business strategies, organizational structures, and process flows. This 16:9 widescreen 2-slide set is ready for immediate editing and presentation use.
Usage Points
-
Main Usage
This diagram visually represents the mutual relationships between three core business elements in a triangular structure. It effectively illustrates interconnected concepts such as management strategy, organizational hierarchy, process flow, and value chain, enhancing audience comprehension.
-
How to Use
Enter key concepts, department names, or process steps in each node's text area, and replace icons to match your presentation topic. This diagram is particularly effective for company overview, strategy development, organizational restructuring, and product development process explanation slides.
-
Recommended For
Executives, strategy managers, organizational development specialists, marketing planners, and project managers benefit from this diagram when explaining business structure, organizational relationships, and process flows. It is highly useful for executive reports, board presentations, organizational change announcements, and strategic planning meetings.
-
Slide Structure
The 2-slide set features a triangular arrangement of three circular nodes on each slide. Central VALUE 01, 02, and 03 text areas are positioned within the triangle, with each node containing an icon and descriptive text space. Two color versions—blue and magenta series—are provided for design flexibility.
Related Products
-

City Business Sector Diagram – Modern Business Approach
#Company Introduction #Product/Service Introduction #Diagram
-

Medical Treatment Description Diagram – Emphasizing Expertise in Healthcare
#Company Introduction #Diagram #Business Areas
-

Space Exploration Theme Connection Diagram
#Company Introduction #Diagram #Business Areas
-

Medical Service Differentiation Strategy Diagram
#Company Introduction #Product/Service Introduction #Diagram
