Square Frame Diagram – Diverse Choices and Visual Trends
RJ0300021_16
- Last Update 04/23/2025
- File Size 5.6MB
- # of Slides 2
- File Format PPTX
- Slide Ratio 16:9
- Color
Keywords
- #Content-Based Slides
- #Design-Based Slides
- #Company Introduction
- #Product/Service Introduction
- #Diagram
- #Business Areas
- #Composition
- #Spread
- #Centralized Diagram
- #16:9
- #square frame diagram PowerPoint
- #4-direction diagram slide
- #central chart template
- #business options diagram
- #how to create comparison diagram in PowerPoint
- #diagram PowerPoint slide download
About the Product
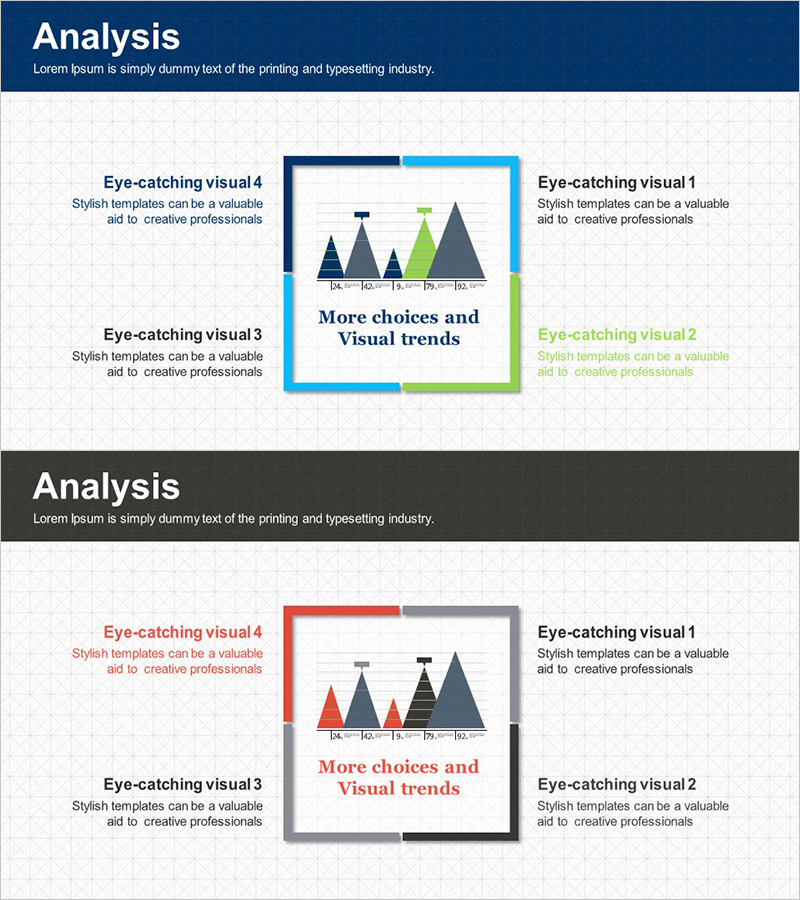
A PowerPoint slide featuring four square frames surrounding a central chart, designed to visualize diverse choices and visual trends. Available in two color themes: navy-light blue-green and navy-gray-red, each frame provides independent text input areas for flexible content customization. Ideal for business presentations comparing multiple options, analyzing market trends, presenting strategic alternatives, and showcasing business diversity. The 2-slide set supports 16:9 widescreen format and is ready for immediate editing.
Usage Points
-
Main Usage
Effectively presents four alternative choices, options, or strategies surrounding a central concept. Perfect for market analysis, product positioning, decision-making processes, and demonstrating business model diversity in a visually balanced layout.
-
How to Use
Place your core message in the central chart area and populate each of the four surrounding frames with different options or trends. Color themes can be adjusted per section or unified to match brand guidelines. Add icons and supplementary text to enhance information clarity and visual impact.
-
Recommended For
Marketing strategy documents, business reports, product presentations, and investment pitch decks. Particularly valuable for executives, marketing teams, strategy consultants, and business analysts presenting comparative analysis or strategic alternatives.
-
Slide Structure
Two-slide set with distinct color themes: Slide 1 features navy-light blue-green palette with 4-direction frame layout; Slide 2 uses navy-gray-red palette with identical structure. Each frame contains independent text zones, and the central area supports scatter plot-style data visualization for enhanced analytical presentation.
Related Products
-

Business Pentagon Diagram – Central Structure
#Company Introduction #Business Introduction #Diagram
-

Mobile App Business Area Diagram – Innovative Visualization
#Company Introduction #Business Introduction #Diagram
-

Camera App Configuration Diagram – Differentiated Business Introduction
#Company Introduction #Product/Service Introduction #Diagram
-

Camera App System Area Diagram – Center of Business and Creativity
#Company Introduction #Business Introduction #Diagram
