System Configuration Diagram Using PC Graphics - Innovation and Efficiency
RJ0300021_15
- Last Update 04/23/2025
- File Size 5.5MB
- # of Slides 2
- File Format PPTX
- Slide Ratio 16:9
- Color
Keywords
About the Product
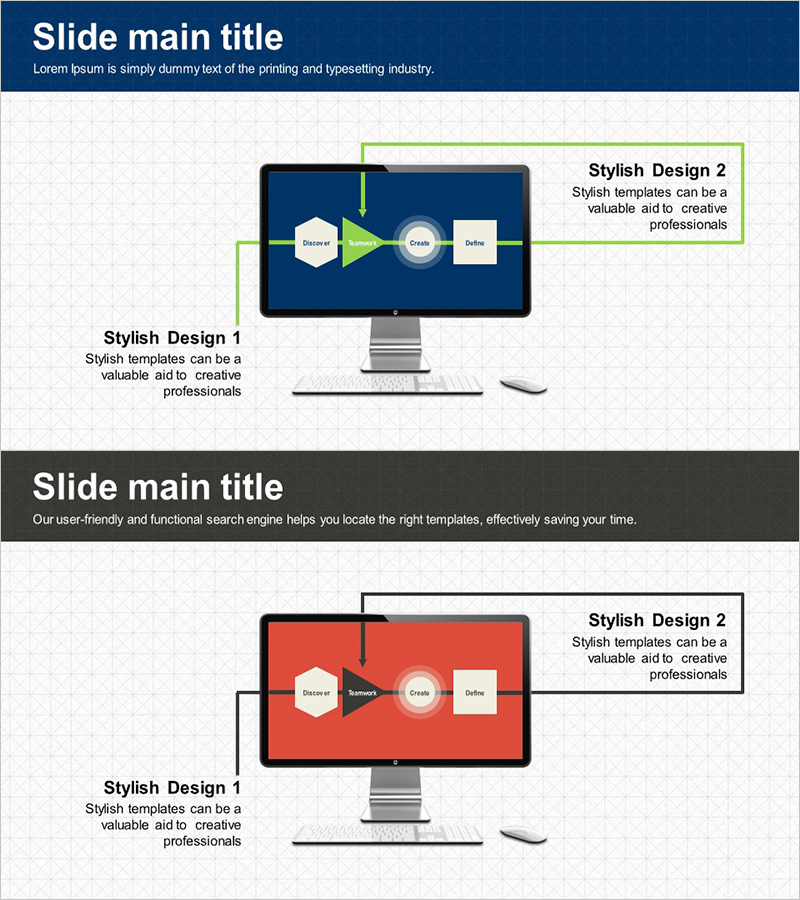
A 4-step connection diagram PowerPoint slide designed to visualize system architecture, IT infrastructure, and process flows. The slide features a navy background with lime green arrows connecting hexagon, circle, and square nodes in a left-to-right progression. Ideal for technology presentations, IT system explanations, and business process documentation. The 2-slide set includes an identical layout with a red background variant, allowing you to differentiate sections by color. All nodes are fully editable for immediate customization and deployment in professional presentations.
Usage Points
-
Main Usage
Effectively communicate complex system architectures, IT infrastructure, and multi-stage business processes through clear visual hierarchy. The diagram emphasizes sequential relationships and dependencies between stages, making technical concepts accessible to diverse audiences in corporate and technical settings.
-
How to Use
Enter stage names, process titles, or system components into each node (hexagon, circle, square). Use the navy-toned slide for sections emphasizing trust and technical credibility, and the red-toned slide for highlighting critical steps, risks, or transformational changes. Arrows clearly indicate flow direction and progression.
-
Recommended For
Technology and IT professionals presenting system designs, software architects explaining infrastructure, project managers outlining implementation roadmaps, and technical educators delivering training materials. Suitable for system migration plans, digital transformation strategies, software development lifecycle documentation, and technical proposal presentations.
-
Slide Structure
2-slide set with identical layouts. Each slide displays 4 connected nodes (hexagon → circle → square → hexagon) linked by lime green directional arrows in a horizontal left-to-right flow. Slide 1 features a navy background; Slide 2 uses the same structure with a red background. All nodes, arrows, and text elements are fully editable for customization.
Related Products
-

Ship System Configuration Diagram – Technology Introduction
#Product/Service Introduction #Technical Approach #Diagram
-

Business Process Diagram for 3D Printing
#Operational Plan #Technical Approach #Diagram
-

Business Process Diagram – Communication Flow
#Operational Plan #Technical Approach #Diagram
-

Chromosome Analysis Diagram – Visual Representation of Cluster Structures
#Technical Approach #Diagram #System Architecture Diagram
