Presentation Calendar – Two Versions
RJ0300020_14
- Last Update 04/23/2025
- File Size 1.2MB
- # of Slides 2
- File Format PPTX
- Slide Ratio 16:9
- Color
Keywords
- #Content-Based Slides
- #Design-Based Slides
- #Business Management
- #Operational Plan
- #Diagram
- #Implementation Plan
- #Project Implementation Schedule
- #Table
- #Standard Table
- #16:9
- #horizontal timeline PowerPoint slide
- #weekly schedule diagram
- #table diagram PowerPoint template
- #project schedule slide
- #7-day timeline PPT
- #business management diagram
- #how to create timeline in PowerPoint
About the Product
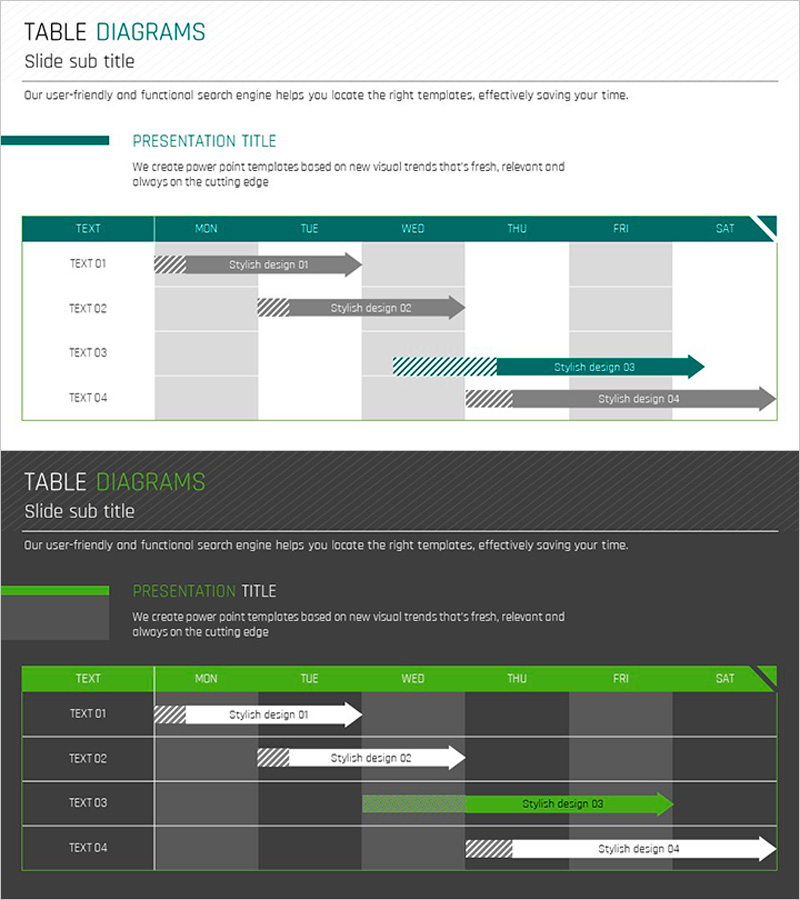
A horizontal table diagram PowerPoint slide designed for visualizing project schedules and weekly planning. The grid layout features seven columns representing Monday through Saturday, with arrow bars clearly displaying the duration of each task or milestone. Two color versions are provided—teal and bright green—with striped patterns and arrow designs that emphasize data flow and timeline progression. This presentation slide is ready to use in business reports, project management decks, operational planning presentations, and marketing schedules.
Usage Points
-
Main Usage
This table diagram is designed to visually represent project schedules, weekly plans, and milestone management. Arrow bars indicate start and end dates for each task, allowing viewers to instantly understand overlapping, sequential, and parallel task relationships.
-
How to Use
Replace TEXT 01–04 labels with actual project names or task descriptions. Adjust arrow bar length and position to reflect real-world timelines. Select the color version that matches your presentation theme, and add or remove rows as needed for your schedule.
-
Recommended For
Project managers, operations coordinators, and marketing planners use this slide in team meetings, executive reports, and client proposals to explain scheduling and timelines. Ideal for business plans, operational plans, and marketing strategy presentations.
-
Slide Structure
Two-slide set. Slide 1: Teal background with 7-column grid (TEXT, MON–SAT), 4 rows (TEXT 01–04), and 4 arrow bars. Slide 2: Green background with identical structure. Each arrow features striped pattern emphasis, and header row uses darker color for distinction.
Related Products
-

Displays the Schedule Step by Step – Clear Communication of Project Timeline
#Business Management #Operational Plan #Diagram
-

Simple Timeline Summary – An Efficient Business Planning Tool
#Business Strategy #Operational Plan #Diagram
-

Summer Itinerary – Travel Planning and Style
#Business Management #Operational Plan #Diagram
-

Business Promotion Roadmap Table – Essential Template for Successful Strategy Execution
#Business Strategy #Operational Plan #Diagram
