Step by Step Business Plan Diagram – Visualization of Business Strategy
RJ0300023_19
- Last Update 04/23/2025
- File Size 0.3MB
- # of Slides 2
- File Format PPTX
- Slide Ratio 16:9
- Color
Keywords
- #Content-Based Slides
- #Design-Based Slides
- #Business Strategy
- #Business Management
- #Diagram
- #Step-by-Step Schedule Plan
- #Implementation Plan
- #Cluster
- #Table
- #Chain Diagram
- #Standard Table
- #16:9
- #circular diagram PowerPoint
- #4-step process slide
- #business strategy presentation
- #cycle flow diagram
- #project planning template
About the Product
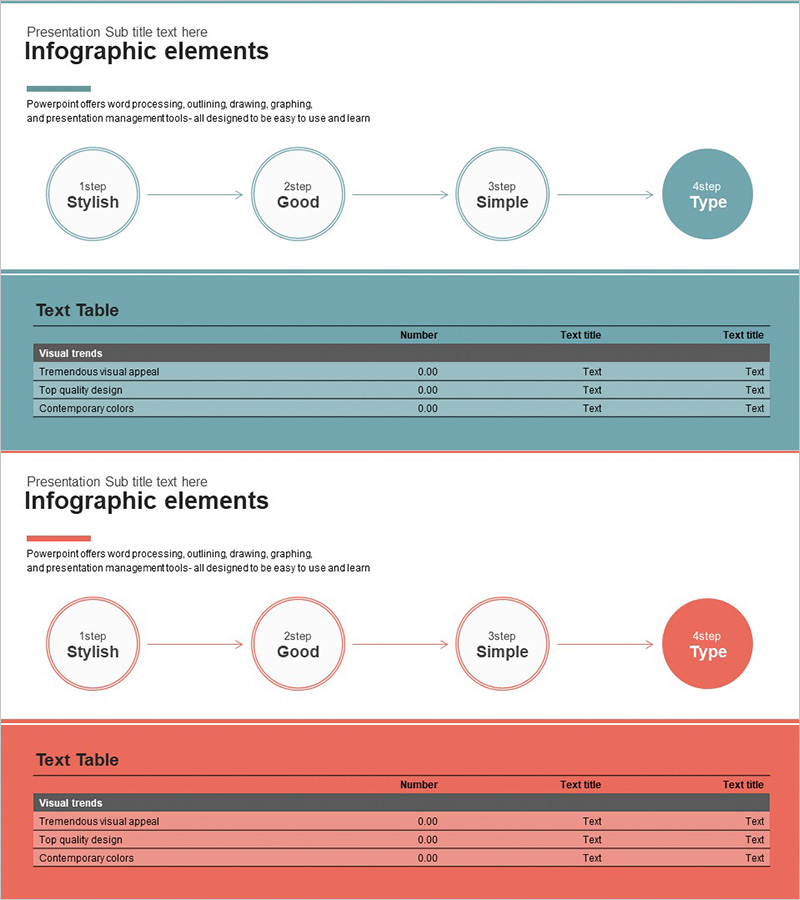
A 4-step circular diagram PowerPoint slide that clearly visualizes the flow of business strategy execution. The first slide features four circular nodes in teal color connected by arrows in a cycle pattern, representing each stage (Stylish, Good, Simple, Type) with directional flow. The second slide combines the same diagram structure with a data table below, enabling quantitative analysis and metrics presentation. Delivered in 16:9 widescreen format with 2 slides, ready for immediate use in business presentations, project management, and strategic planning documents. The circular flow effectively communicates iterative processes and stage-by-stage progression.
Usage Points
-
Main Usage
Visualize business execution strategy through a circular process structure, emphasizing stage connectivity and iterative cycles. Ideal for project management, continuous improvement cycles, and business process explanation in presentations.
-
How to Use
Use the first slide's diagram to introduce the process overview, then present detailed information (metrics, owners, timelines) in the second slide's table. Edit node labels and table data to match your specific business stages and requirements.
-
Recommended For
Business planners, project managers, operations directors, and strategy teams preparing business plans, strategic reports, project management documents, improvement proposals, and operational planning presentations.
-
Slide Structure
Slide 1: Teal background with 4 circular nodes (approximately 80px diameter each) connected by directional arrows in circular flow. Slide 2: Same diagram at top + 4-row, 4-column data table below (columns: Visual trends, Number, Text title, Text title). Full 16:9 aspect ratio, PPTX format.
Related Products
-

Step-by-Step Mountain Climbing Business Plan Slide
#Business Strategy #Business Management #Diagram
-

Phase-Based Execution Flow Diagram – Visualizing Business Strategy
#Business Strategy #Business Management #Diagram
-

Mountain Climbing Aftercare and Maintenance Plan
#Business Strategy #Business Management #Diagram
-

5-Step Linear Circle Diagram – Business Strategy
#Business Strategy #Business Management #Operational Plan
