Business Progress Diagram Slide – Strategy for Efficient Progress
RJ0300019_16
- Last Update 04/22/2025
- File Size 11MB
- # of Slides 2
- File Format PPTX
- Slide Ratio 16:9
- Color
Keywords
- #Content-Based Slides
- #Design-Based Slides
- #Product/Service Introduction
- #Business Strategy
- #Diagram
- #Development Status
- #Business Direction
- #Flow
- #Linear Flow
- #16:9
- #progress arrow diagram PowerPoint
- #3-stage progress slide
- #business progress diagram
- #project timeline PowerPoint slide
- #achievement percentage chart
About the Product
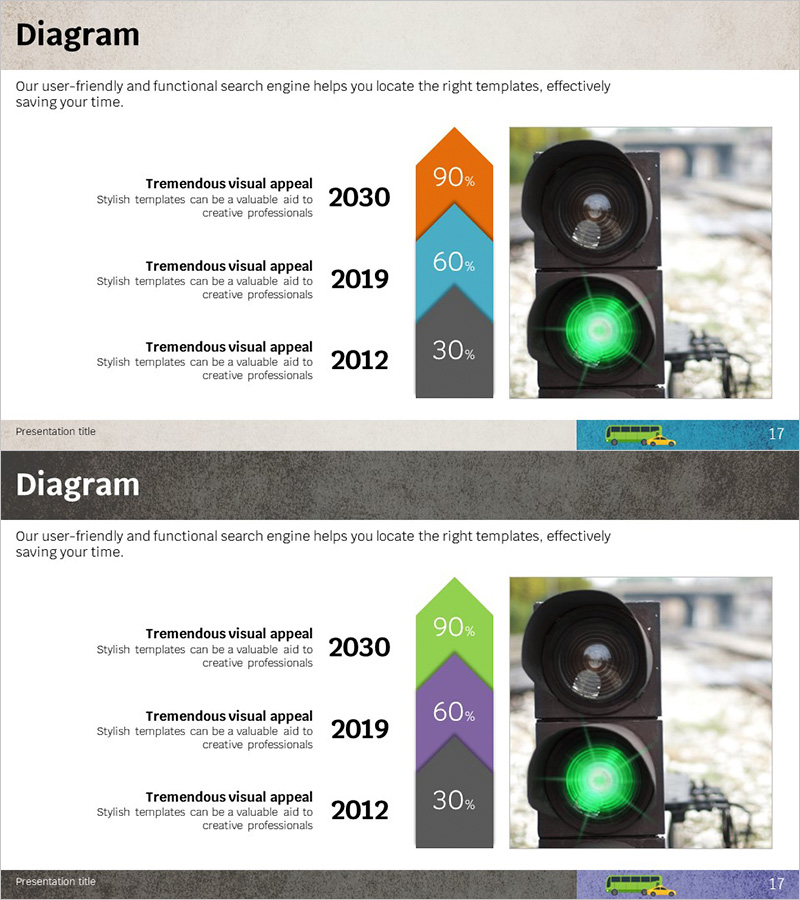
A 3-stage arrow diagram PowerPoint slide that visually represents business progress and project milestones. This 2-slide set uses orange, blue, and gray color tones with arrow shapes to clearly display year-by-year progress and achievement percentages. Each stage includes editable fields for percentage data, making it ideal for business plans, project status updates, and strategic roadmap presentations. The structure allows easy text and numeric customization, perfect for corporate reports, strategy presentations, and performance-sharing meetings.
Usage Points
-
Main Usage
Visualize business progress, project milestones, and strategic execution roadmaps across time phases, with achievement percentages displayed at each stage to provide clear, at-a-glance progress tracking.
-
How to Use
Use in executive reports, quarterly performance presentations, project status updates, and strategic plan explanations to communicate progress clearly to stakeholders. Easily edit text and percentage values to reflect your organization's actual data and timelines.
-
Recommended For
Executives, project managers, strategic planning teams, sales and marketing professionals presenting business progress to stakeholders. Particularly effective for quarterly reviews, annual business plan presentations, investor reports, and milestone tracking.
-
Slide Structure
2-slide template with 3 arrow shapes per slide representing stages or years. Each arrow contains editable fields for percentage data. Color-coded with orange, blue, and gray to distinguish stages visually and enhance clarity.
Related Products
-

Touch Wide Diagram PowerPoint Template for Linear Flow
#Business Strategy #Technical Approach #Diagram
-

Antique Template Goal Diagram – Business Strategy and Direction
#Business Vision and Strategy #Business Strategy #Diagram
-

Voice of Customer Reflected in Planning – Visualizing Business Strategy
#Business Strategy #Diagram #Business Direction
-

Identity Presentation Wide Circular Connection Diagram
#Business Strategy #Operational Plan #Diagram
