Blue Green Highlighter Area Chart – A Tool for Market Analysis and Strategy Development
RJ0300012_6
- Last Update 04/21/2025
- File Size 1.2MB
- # of Slides 2
- File Format PPTX
- Slide Ratio 16:9
- Color
Keywords
- #Content-Based Slides
- #Design-Based Slides
- #Market and Competitor Analysis
- #Marketing Plan and Strategy
- #Graph
- #Other
- #Future Outlook
- #Target Market Strategy
- #16:9
- #area chart PowerPoint slide
- #area chart presentation template
- #time series data visualization slide
- #market analysis chart PPT
- #two-layer area chart
About the Product
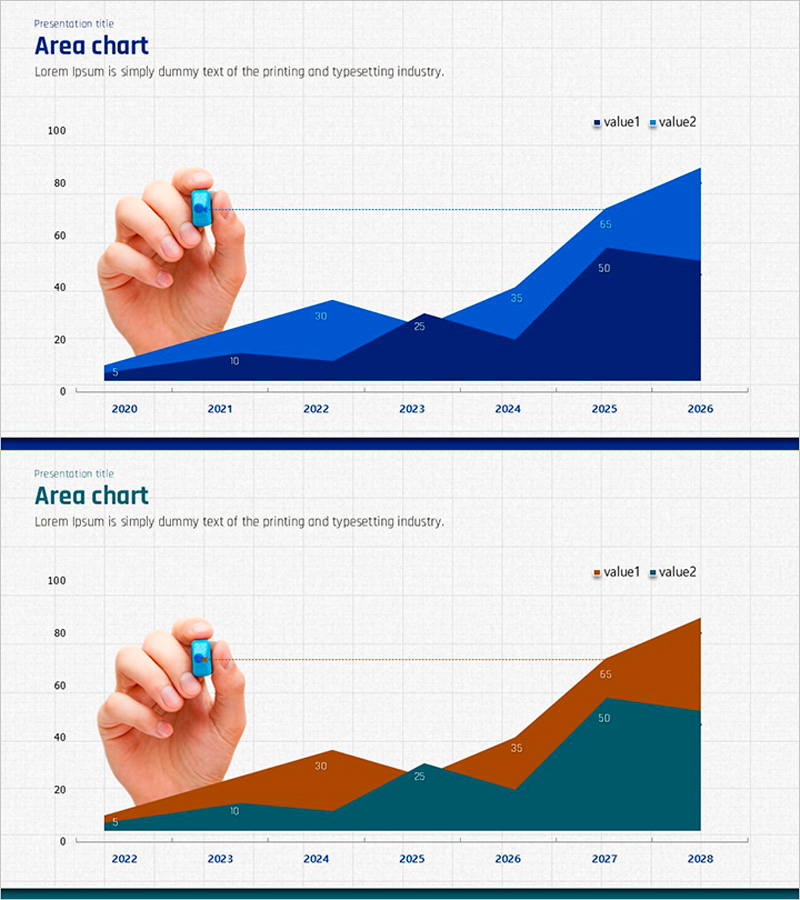
A 2-slide area chart PowerPoint presentation designed for market analysis and strategic planning. The first slide features a two-layer composition with dark blue and light blue, while the second slide uses dark teal and orange to represent time series data trends. Each slide includes a title section, descriptive text area, and a hand gesture illustration on the left to enhance visual impact. You can input various financial and marketing metrics such as revenue, market share, or customer count for periods spanning 2020–2026 or 2022–2028. The slides are in 16:9 widescreen PPTX format and ready for immediate editing and customization.
Usage Points
-
Main Usage
This slide effectively visualizes time series data across two layers, such as market trends, competitor market share, or revenue progression. The stacked area chart structure simultaneously displays overall scale and individual item changes, making it ideal for presenting decision-making insights during market analysis, financial reporting, and strategic planning phases.
-
How to Use
Enter your analysis topic in the title area (e.g., Market Share Trends, Revenue by Customer Segment) and key insights in the description text field. Replace the chart data values (5–100 range) with actual figures to represent year-over-year or quarterly trends. The hand gesture illustration combined with your data creates strong audience engagement.
-
Recommended For
Recommended for investor presentations, marketing team market analysis reports, strategic planning sessions, and sales team customer overview presentations. Particularly effective when emphasizing the relationship between two metrics or highlighting shifts in competitive dynamics.
-
Slide Structure
Each slide consists of a title section (Presentation title), descriptive text area (Lorem Ipsum), a hand gesture illustration on the left, and an area chart on the right. The chart includes an X-axis (years 2020–2026 or 2022–2028), Y-axis (0–100 scale), a two-layer color legend (value1, value2), and numeric labels at each data point for precise value communication.
Related Products
-

Astronomy Research Topic Positioning – Insightful Market Analysis
#Market and Competitor Analysis #Marketing Plan and Strategy #Diagram
-

Children's Education Area Graph – Market Trends Analysis
#Market and Competitor Analysis #Graph #Other
-

Card Payment Service Overview and Analysis Graph
#Company Introduction #Market and Competitor Analysis #Graph
-

Country-by-Country Analysis Comparison Chart – Market and Competitor Analysis
#Market and Competitor Analysis #Marketing Plan and Strategy #Graph
