Blue Green Table Chart – The Key to Data Visualization
RJ0300012_13
- Last Update 04/21/2025
- File Size 0.9MB
- # of Slides 2
- File Format PPTX
- Slide Ratio 16:9
- Color
Keywords
About the Product
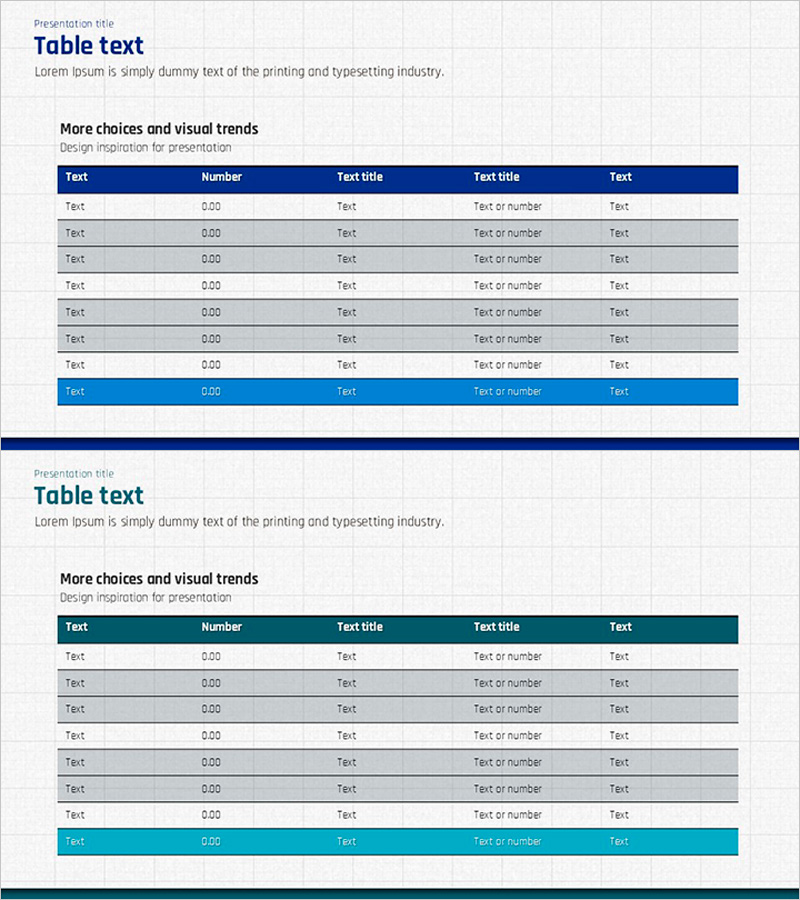
A data comparison table PowerPoint slide with 5 columns and 7 rows, featuring a dark blue header and alternating light gray and teal row backgrounds for clear information hierarchy. This structure enables simultaneous alignment of numbers, text, and categories, making it ideal for visualizing financial reports, sales performance, customer analysis, and market research data. The 2-slide set offers multiple color combinations (blue and teal) optimized for 16:9 widescreen format. Cells are ready for immediate data entry with adjustable row heights, and the template integrates seamlessly into presentations, reports, and business proposals.
Usage Points
-
Main Usage
The core function is to organize and compare numerical, textual, and categorical data in a matrix format. The dark blue header emphasizes key items, while alternating gray and teal rows enhance data readability. Highly effective for conveying quantitative information such as financial status, sales performance, customer segmentation, and market share.
-
How to Use
Ideal for business reports, investor presentations, marketing plans, and quarterly performance reviews that require data-driven decision support. Enter item names (Text, Number, Text title, etc.) in the header row and specific figures and descriptions in data rows. Color combinations can be adjusted to match brand guidelines.
-
Recommended For
Recommended for finance and accounting teams presenting monthly and quarterly results, marketing teams analyzing channel and regional performance, sales teams reporting customer and product revenue, and executives organizing dashboard data. Also suitable for academic presentations, consulting reports, and government proposals requiring objective data representation.
-
Slide Structure
The 2-slide set features the first slide with dark blue header and gray data rows, and the second with teal header and light teal rows for color variation. Each slide maintains 5 columns (Text, Number, Text title, Text title, Text) and 7 data rows, with the final row highlighted for totals or conclusions.
Related Products
-

Dynamic Triangle Pattern Inclusion Diagram – Business Vision and Strategy
#Business Vision and Strategy #Business Management #Diagram
-

PowerPoint Template for Service Operation Strategy Presentation
#Business Management #Operational Plan #Technical Approach
-

Car PPT Template Wide template Diagram8 – Effective Product Introduction
#Product/Service Introduction #Diagram #Features
-

Real Estate Business Marketing Diagram – Innovative Systems Design
#Technical Approach #Diagram #System Architecture Diagram
