Development Status Analysis Notebook Diagram – Effective Data Visualization
RJ0300010_12
- Last Update 04/20/2025
- File Size 4.1MB
- # of Slides 2
- File Format PPTX
- Slide Ratio 16:9
- Color
Keywords
About the Product
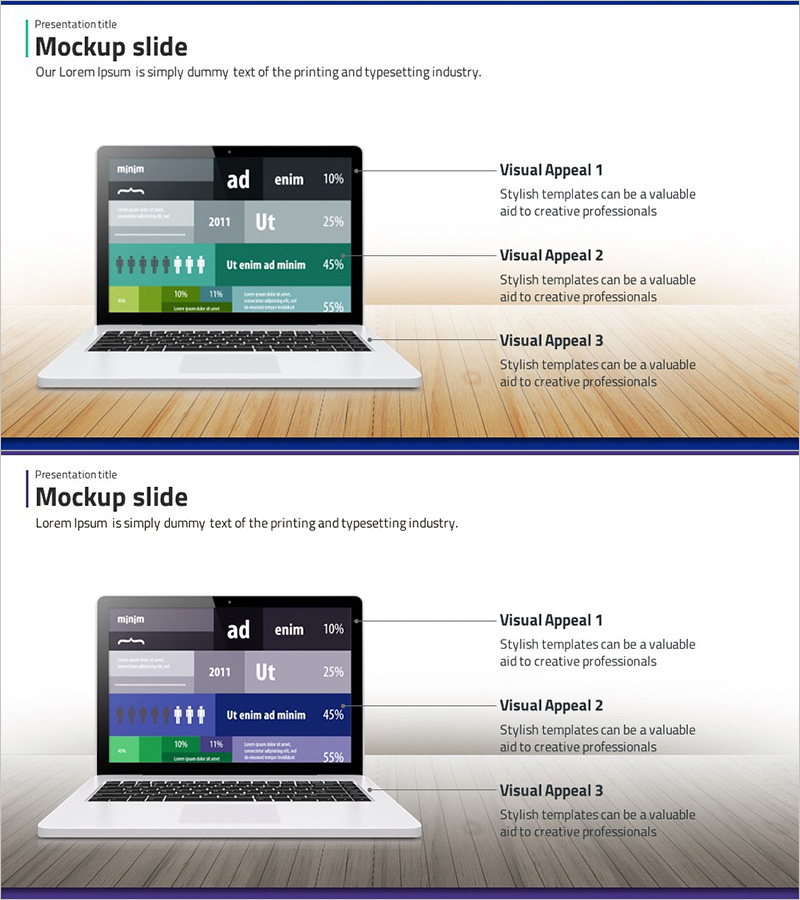
A PowerPoint slide set featuring a notebook mockup displaying development status data in a professional presentation format. The 2-slide collection includes the first slide with green-toned charts and infographics, and the second with blue-toned variants for color flexibility. Each slide contains 3 text input areas and 4 data visualization zones (charts, icons, metrics, legends) to communicate development progress rates, year-over-year statistics, team headcount, and budget allocation at a glance. Ready to use in presentations, status reports, and business slides.
Usage Points
-
Main Usage
Visualize development project progress, statistical data, team headcount, and budget information using a notebook screen mockup format to clearly communicate with executives, investors, and team members. Emphasizes technical credibility and data-driven decision-making.
-
How to Use
Use in technology presentations, project status reports, investor pitch meetings, and quarterly performance reviews as the development status section. Input actual charts and metrics into the notebook screen area, and fill text boxes with project name, timeline, and objectives. Adjust colors to match corporate branding.
-
Recommended For
Software development teams, technical leads, project managers, startup founders, technology company executives, and investors presenting project updates. Ideal for reporting development progress rates, technology roadmaps, and system implementation status.
-
Slide Structure
Each slide features a title area at the top (1 zone), a central notebook mockup image area, and right-aligned explanation text zones (3 areas). The notebook screen contains 4 data visualization zones (charts, infographics, metrics, legends) enabling multi-layered representation of development statistics.
Related Products
-

Introduction to IT Infrastructure Services – Customer-Centric Effective Solutions
#Product/Service Introduction #Diagram #Other
-

Smartphone App Service Characteristics Diagram – Visual Expansion
#Product/Service Introduction #Diagram #Features
-

Car Map Product Introduction PowerPoint Template – Modern Design
#Product/Service Introduction #Diagram #Other
-

Cluster Diagram Slide Visualizing Technical Characteristics
#Product/Service Introduction #Diagram #Other
