Tablet Shape Structure Diagram – Visualization of Technology and Service Composition
RJ0300010_11
- Last Update 04/20/2025
- File Size 1MB
- # of Slides 2
- File Format PPTX
- Slide Ratio 16:9
- Color
Keywords
- #Content-Based Slides
- #Design-Based Slides
- #Technical Approach
- #Diagram
- #Service Architecture Diagram
- #System Architecture Diagram
- #Structure
- #Tree Diagram
- #16:9
- #tablet diagram PowerPoint
- #hierarchical structure diagram slide
- #technology service architecture
- #system composition diagram
- #tree structure PowerPoint template
About the Product
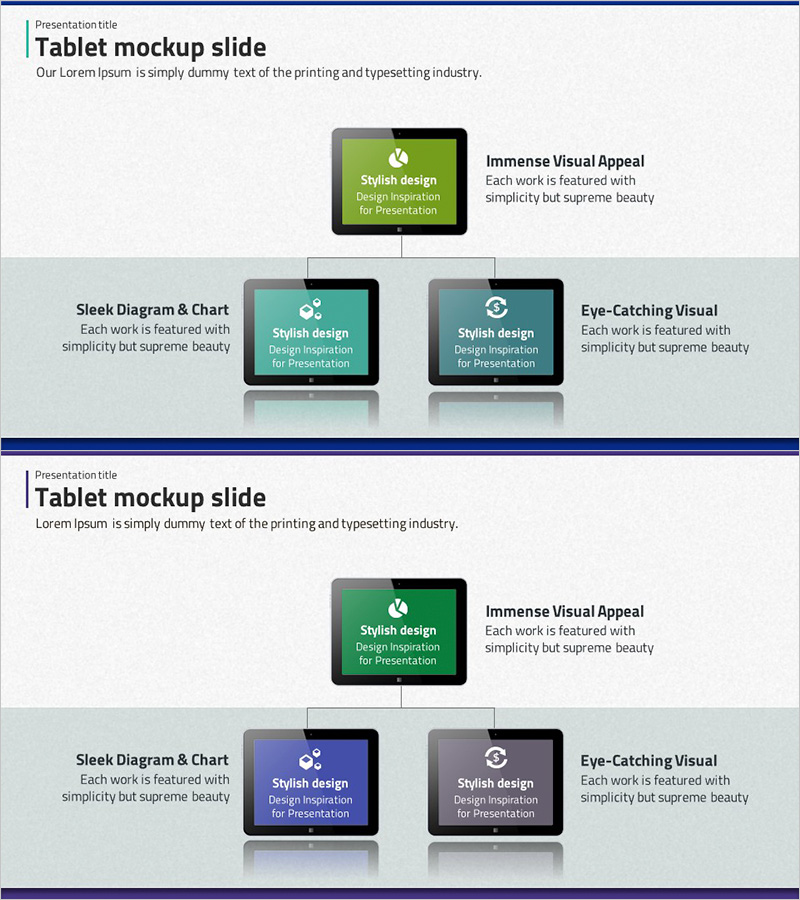
A 3-level hierarchical tree structure diagram in PowerPoint featuring tablet-shaped nodes. The top lime-green tablet branches downward via vertical connector lines to two lower tablets in turquoise and gray, visualizing the relationship between technology and service divisions. Each node includes icons and text input areas for easy customization. The 2-slide deck uses a 16:9 widescreen PPTX format with color-coded layers for clear information hierarchy. Ideal for technology roadmaps, service portfolio presentations, system architecture diagrams, and organizational structure explanations in business, IT, and product development contexts.
Usage Points
-
Main Usage
Visualizes hierarchical relationships between technology and service divisions using a tree structure diagram. The top central node branches into two lower nodes, making it ideal for expressing organizational hierarchies, technology roadmaps, service portfolios, and system architectures where vertical relationships are essential.
-
How to Use
Edit the text in each tablet area to input department names, technology names, or service names. Icons can be replaced by category, and colors are fully customizable to match corporate branding. Use in technology presentations, strategy meetings, and product introduction decks to explain organizational structures or service layers.
-
Recommended For
Recommended for technology managers, product managers, marketing professionals, and executives presenting technology roadmaps, service compositions, and organizational hierarchies. Suitable for IT companies, software firms, telecommunications providers, and fintech divisions in strategy presentations, investor briefings, and internal training materials.
-
Slide Structure
2-slide deck. Slide 1: Top center lime-green tablet (1 node) with vertical connectors branching to bottom-left turquoise and bottom-right gray tablets (2 nodes). Slide 2: Color variation with blue replacing lime-green while maintaining turquoise and gray. Each node includes icon placeholder and text input area. 16:9 widescreen format.
Related Products
-

Trial Tree Structure – Legal and Service Overview
#Technical Approach #Diagram #Service Architecture Diagram
-

Circular Tree Structure Slide – Efficient Service Diagram
#Technical Approach #Diagram #Service Architecture Diagram
-

Auto Business Ops Diagram – Efficiency and Innovation
#Technical Approach #Diagram #Service Architecture Diagram
-

Organizational Structure Analysis - Efficient System Model
#Technical Approach #Diagram #Service Architecture Diagram
