Sustainable Operation System Diagram – Efficiency and Innovation
RB0100040_8
- Last Update 03/05/2025
- File Size 0.4MB
- # of Slides 2
- File Format PPTX
- Slide Ratio 4:3
- Color
Keywords
- #Content-Based Slides
- #Design-Based Slides
- #Technical Approach
- #Diagram
- #Service Architecture Diagram
- #System Architecture Diagram
- #Structure
- #Spread
- #Tree Diagram
- #Centralized Diagram
- #4:3
- #radial diagram PowerPoint
- #central hub diagram slide
- #3-node system diagram
- #operational system visualization
- #how to create radial diagram in PowerPoint
About the Product
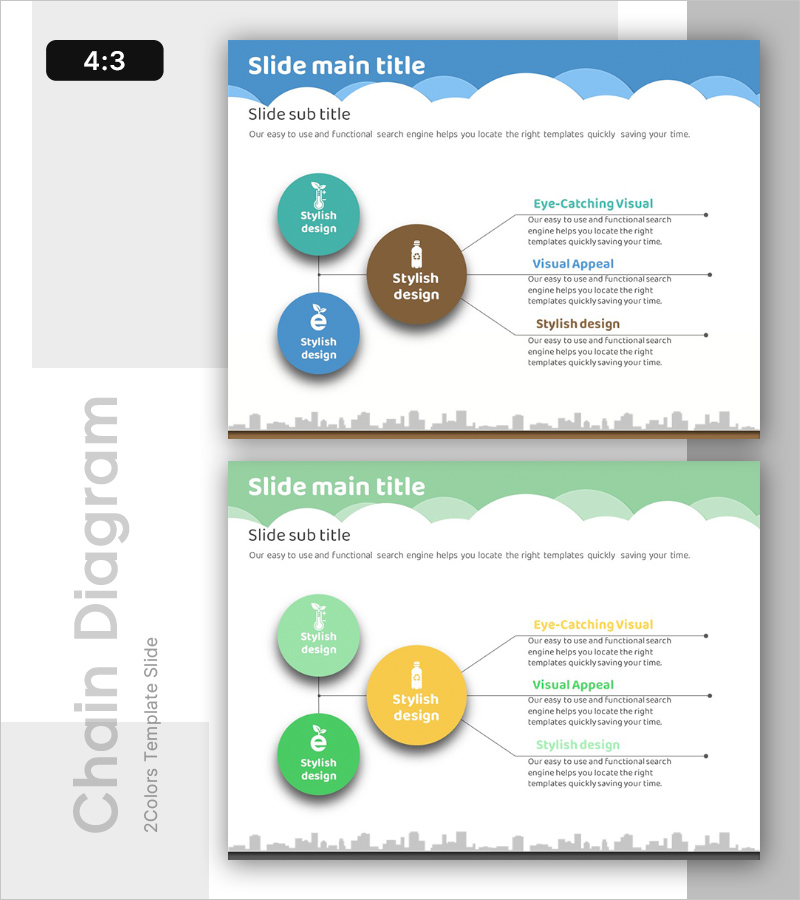
A radial diagram PowerPoint slide featuring a central hub concept with three nodes extending outward in a sunburst pattern. The design uses brown, turquoise, and blue circular nodes connected by lines to right-aligned text labels, creating a clear hierarchical relationship visualization. Perfect for illustrating operational systems, service architectures, technology frameworks, and strategic components. The 4:3 aspect ratio template includes 2 fully editable slides ready for immediate use in business presentations, strategic plans, and corporate reports.
Usage Points
-
Main Usage
Visualize organizational systems, service ecosystems, or technology architectures by positioning a core concept at the center with three major components radiating outward. This structure effectively communicates multi-layered relationships and hierarchical dependencies in business models, strategic frameworks, and operational structures.
-
How to Use
Enter your core concept in the central brown circle (e.g., Operating System). Place three main categories or components in the surrounding turquoise and blue circles (e.g., Efficiency, Innovation, Sustainability). Add detailed descriptions in the right-aligned text areas. All colors, fonts, and text are fully customizable to match your brand guidelines.
-
Recommended For
Executive presentations, strategic planning documents, business proposals, operational reports, technology architecture briefings, organizational structure explanations, board meetings, team training sessions, and consulting presentations. Suitable for C-suite executives, product managers, technical leads, and business strategists.
-
Slide Structure
2-slide template in 4:3 ratio PPTX format. Slide 1: Cloud-patterned header + 1 central brown node + 2 surrounding nodes (turquoise, blue) + 3 right-aligned text labels with connector lines + cityscape footer. Slide 2: Identical layout with green and yellow color variation for visual diversity.
Related Products
-

Brown Composition Diagram of the Background of Ingredients – Efficient System Structuring
#Technical Approach #Diagram #Service Architecture Diagram
-

Trial Tree Structure – Legal and Service Overview
#Technical Approach #Diagram #Service Architecture Diagram
-

Securities Services Diffusion Diagram – Effective System Composition
#Technical Approach #Diagram #Service Architecture Diagram
-

System Services Diffusion Diagram - Visualization for Technology Sector
#Technical Approach #Diagram #Service Architecture Diagram
