Attribute Area Circle Diagram – Visualizing Various Outcomes
RJ0300009_16
- Last Update 04/20/2025
- File Size 0.1MB
- # of Slides 2
- File Format PPTX
- Slide Ratio 16:9
- Color
Keywords
- #Content-Based Slides
- #Design-Based Slides
- #Product/Service Introduction
- #Business Strategy
- #Diagram
- #Features
- #Achievements
- #Cluster
- #Spread
- #Inclusive Cluster Diagram
- #16:9
- #concentric circle diagram PowerPoint
- #nested circle diagram slide
- #4-layer hierarchy visualization
- #circular diagram template
- #how to create circle diagram in PowerPoint
About the Product
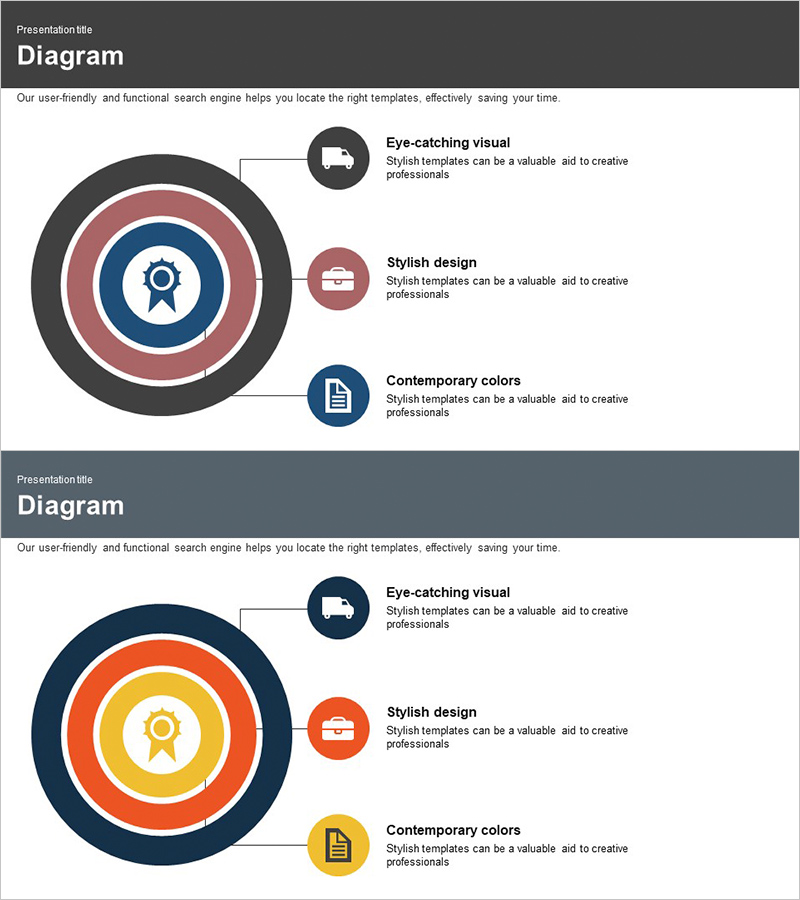
A 4-layer concentric circle diagram PowerPoint slide that visualizes hierarchical information radiating from a central core concept. The design features navy blue, burgundy, yellow, and charcoal color rings arranged in nested circles, with icon placeholders and text description areas at each level. This presentation slide template is ideal for business strategy stages, performance analysis, organizational capabilities, and attribute-based classifications. The 2-slide set includes color variations to suit different presentation contexts. Delivered in 16:9 widescreen PPTX format for immediate editing and customization.
Usage Points
-
Main Usage
Effectively visualizes multi-level information structures radiating from a central concept. Ideal for presenting business strategy phases, layered performance metrics, organizational capability frameworks, and hierarchical attribute classifications in a clear, intuitive manner.
-
How to Use
Enter your core topic in the center circle, then add specific items and descriptions to each concentric ring. Insert relevant icons in the icon placeholders and populate the text boxes with detailed content. Color scheme can be retained as-is or modified to match your brand guidelines.
-
Recommended For
Executives, strategy managers, marketing planners, project managers, and consultants presenting business strategies, performance analyses, organizational structures, and hierarchical classifications. Suitable for inclusion in business reports, proposals, strategic plans, and executive presentations.
-
Slide Structure
2-slide set featuring 4-layer concentric circle structure on each slide. Central core circle surrounded by burgundy, yellow, navy, and charcoal rings in nested arrangement. Each layer includes a circular icon placeholder and adjacent text description area positioned to the right. 16:9 widescreen PPTX format.
Related Products
-

Two Nested Diagrams – Product Introduction and Composition
#Product/Service Introduction #Diagram #Features
-

Cloud Folder Characteristics Diagram - Emphasizing Visual Trends and Creativity
#Product/Service Introduction #Diagram #Features
-

Firefighter Illustration Infographic – Eye-Catching Visuals
#Product/Service Introduction #Business Introduction #Diagram
-

Operational Features of the Financial System – Highlighting Value through Data Analysis
#Product/Service Introduction #Business Introduction #Diagram
