Market Analysis Rectangular Area Graph – Insights for Data Interpretation
RJ0300009_11
- Last Update 04/20/2025
- File Size 0.2MB
- # of Slides 2
- File Format PPTX
- Slide Ratio 16:9
- Color
Keywords
About the Product
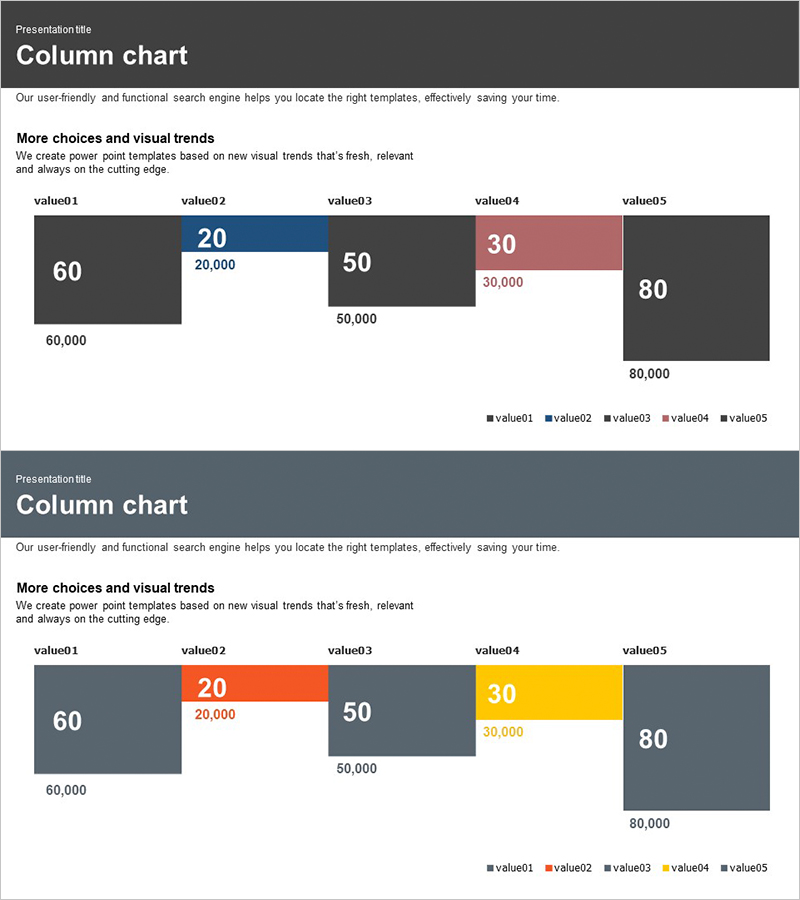
A PowerPoint slide template designed for market analysis and data comparison presentations. This rectangular area graph layout visualizes five independent data values with clear visual hierarchy using dark gray background and accent colors (blue, red, yellow). Each area includes dedicated text fields for labels and numerical values. The 2-slide set provides a base layout and a color variation version. In 16:9 widescreen PPTX format, fully editable and ready to use. Ideal for presenting market share, competitive analysis, revenue composition, customer segmentation, and other business metrics in reports and investor presentations.
Usage Points
-
Main Usage
Display and compare multiple data values simultaneously in market analysis presentations. Each rectangular area represents an independent data point, making it ideal for visualizing market share, competitor size, revenue composition, customer segment distribution, and similar comparative metrics.
-
How to Use
Enter data labels (value01 through value05) and corresponding numbers in the text boxes within each rectangular area. Choose between the base color scheme (blue, red, gray) or the variation version (orange, yellow, gray). The dark background enhances readability of numerical data for both printed and screen presentations.
-
Recommended For
Recommended for marketing professionals, business development teams, and executive presentations. Particularly effective for sharing market research findings, competitive analysis, business performance reviews, and investor pitches on market conditions. Suitable for consulting firms, financial institutions, and manufacturing companies in strategy meetings.
-
Slide Structure
2-slide set with the first slide featuring a 5-area rectangular layout in blue, red, and gray tones, and the second slide showing a color variation with orange, yellow, and gray. Each area contains three text input levels: label at top, primary value in center, and detailed value at bottom.
Related Products
-

Triangular Pattern Presentation Template Area Chart – Market Analysis and Competitive Edge
#Market and Competitor Analysis #Graph #Other
-

Galaxy Theme Market Analysis Area Graph
#Market and Competitor Analysis #Graph #Other
-

Curved Hill Shape Graph – Market Trend and Growth Analysis
#Market and Competitor Analysis #Graph #Other
-

Camping Market Trend Survey Line Graph – Trend Displayed in Orange and Yellow
#Market and Competitor Analysis #Graph #Other
