Marketing Effectiveness Analysis Mixed Graph – Insights into Market Trends
RM0400011_31
- Last Update 02/18/2025
- File Size 0.5MB
- # of Slides 2
- File Format PPTX
- Slide Ratio 16:9
- Color
Keywords
About the Product
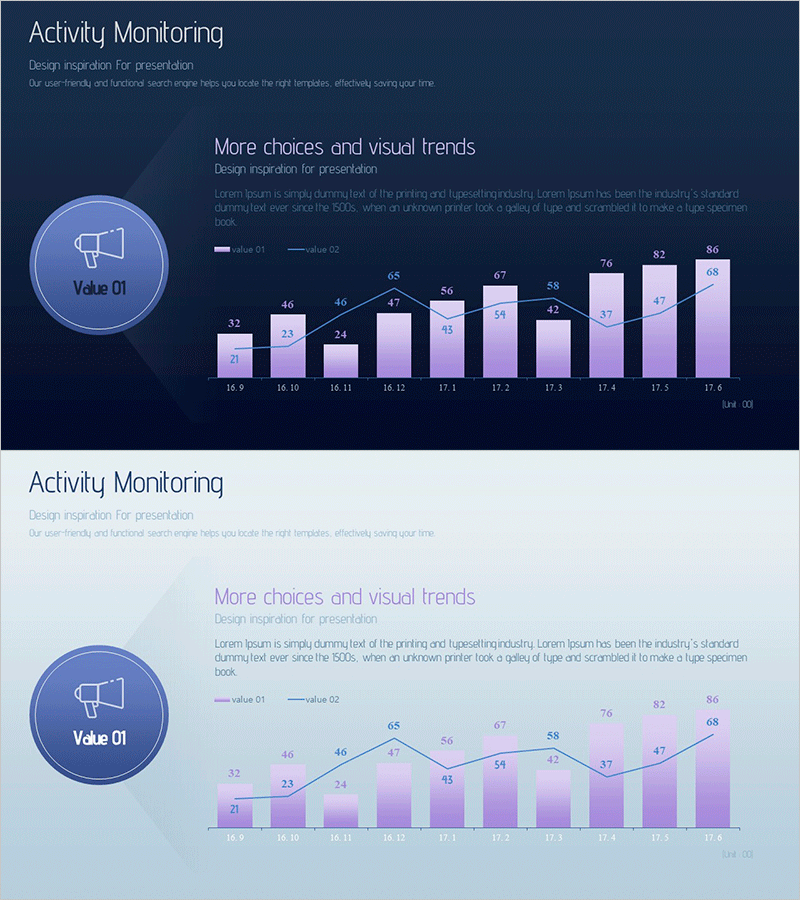
A mixed-type graph PowerPoint slide that visualizes marketing effectiveness and market trends simultaneously. This presentation template combines bar charts and line graphs in a dual-axis structure, enabling side-by-side comparison of two key metrics. The dark navy background with lavender bars and white line elements enhances data readability and visual impact. The 16:9 widescreen format includes 2 slides ready for immediate use in marketing performance reports, market share trend analysis, and competitive benchmarking presentations. Clearly defined data input areas allow you to quickly apply actual figures without redesigning the layout.
Usage Points
-
Main Usage
This slide is designed to present marketing campaign effectiveness and market trend changes in a single visualization. The bar chart represents absolute values (revenue, customer count) while the line graph shows trends (growth rate, market share), supporting executive and marketing team decision-making.
-
How to Use
Use this slide in marketing reports, quarterly performance presentations, and competitive benchmarking materials when comparing two or more metrics. Input your actual data into the designated areas, and the chart updates automatically to reflect your figures.
-
Recommended For
Ideal for marketing teams, sales departments, and executive presentations. Particularly effective for advertising effectiveness analysis, channel performance comparison, and explaining market share trends to stakeholders.
-
Slide Structure
The 2-slide set includes one slide for marketing effectiveness analysis and another for market trend comparison. Each slide features a title area, legend (Value 01 and Value 02), bar chart input zones (approximately 10 data points), and a line graph area for trend visualization.
Related Products
-

Simple Car Wide Presentation Area Chart
#Market and Competitor Analysis #Graph #Other
-

Vertical Bar PC Mockup Graph – Market and Competitive Analysis
#Market and Competitor Analysis #Graph #Other
-

Stacked Bar Chart by Country – Visualizing Market Trends
#Market and Competitor Analysis #Graph #Other
-

100% Stacked Bar Chart Abstract Pattern Presentation
#Market and Competitor Analysis #Graph #Other
