Insight Slide with Visual Charts for Trend Communication
RJ0200070_4
- Last Update 09/09/2025
- File Size 1.9MB
- # of Slides 2
- File Format PPTX
- Slide Ratio 16:9
- Color
Keywords
- #Content-Based Slides
- #Design-Based Slides
- #Market and Competitor Analysis
- #Marketing Plan and Strategy
- #Diagram
- #Graph
- #Market Status
- #Target Market Strategy
- #Table
- #Other
- #Horizontal Table
- #16:9
- #concentric circle diagram PowerPoint
- #circular diagram slide template
- #data visualization PPT
- #marketing analytics chart
- #trend analysis presentation slide
About the Product
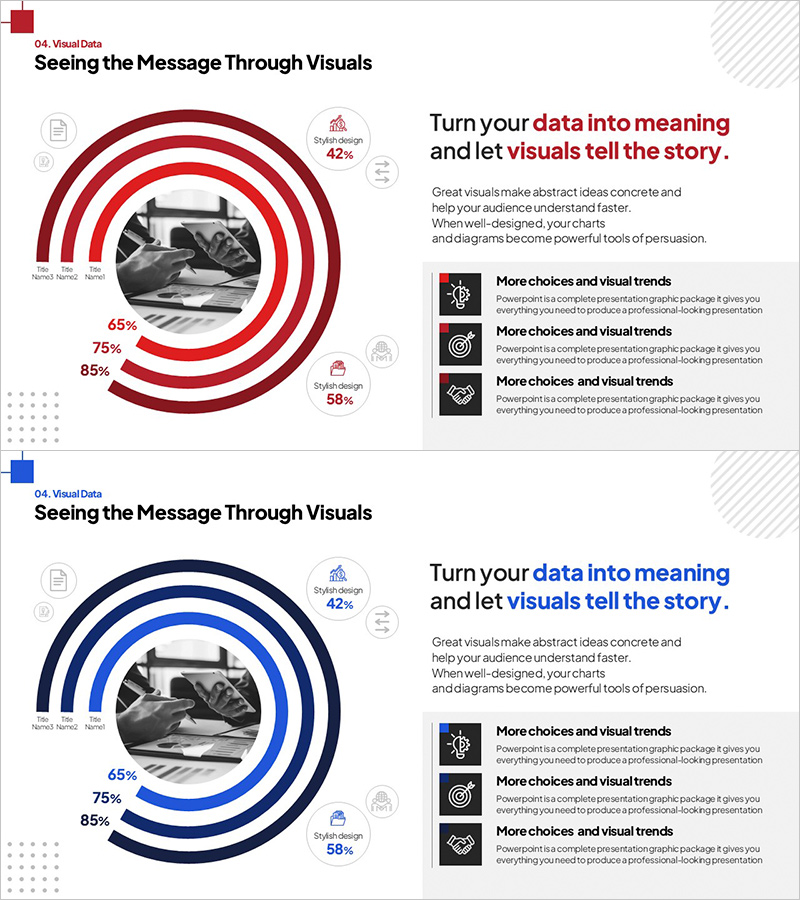
A circular data visualization PowerPoint slide featuring five concentric rings centered around a focal image. Key metrics (65%, 75%, 85%) are positioned on each layer to enable hierarchical data comparison and multi-level information delivery. Available in dark red and navy color schemes, this presentation slide is optimized for insight-driven pitches including marketing strategy, market analysis, and trend reports. The 16:9 widescreen format includes 2 fully editable slides ready for immediate use.
Usage Points
-
Main Usage
Visualize hierarchical data and multi-level metrics by positioning core messaging at the center and layering supporting data across five concentric rings. Effectively communicates marketing performance, market share, customer satisfaction, and competitive positioning.
-
How to Use
Insert your core subject or product image in the center area. Add metrics, KPIs, or descriptions to each concentric ring layer. Select your preferred color scheme (dark red or navy) to align with brand guidelines and apply to your presentation.
-
Recommended For
Marketing teams presenting campaign performance, sales teams reporting market conditions, executive strategy briefings, consulting reports, and trend analysis documents. Ideal for data-driven B2B presentations requiring multi-dimensional metric visualization.
-
Slide Structure
2-slide set. Slide 1: Dark red 5-layer concentric circles with centered black-and-white image, right-side text area with title, description, and 3 icon boxes. Slide 2: Navy color variant with identical layout. Each ring layer accommodates percentage values and supporting metrics.
Related Products
-

Business Plan Presentation Template Bar Diagram Sample
#Market and Competitor Analysis #Marketing Plan and Strategy #Graph
-

Business Status Analysis Graph & Table – Visualization of Market Analysis
#Market and Competitor Analysis #Diagram #Graph
-

Modern Wide PowerPoint Template Area Chart
#Business Strategy #Market and Competitor Analysis #Graph
-

Market Analysis Table & Circular Graph
#Market and Competitor Analysis #Diagram #Graph
