Blue Line Wide Template Vertical Bar Chart – Ideal for Business Strategy
RJ0200066_23
- Last Update 04/18/2025
- File Size 0.1MB
- # of Slides 2
- File Format PPTX
- Slide Ratio 16:9
- Color
Keywords
- #Content-Based Slides
- #Design-Based Slides
- #Business Strategy
- #Marketing Plan and Strategy
- #Graph
- #Promotion Strategy
- #Column
- #Grouped Column
- #Project Progress
- #16:9
- #vertical bar chart PowerPoint
- #grouped bar chart presentation
- #business performance slide
- #year-over-year comparison graph
- #marketing strategy PPT slide
About the Product
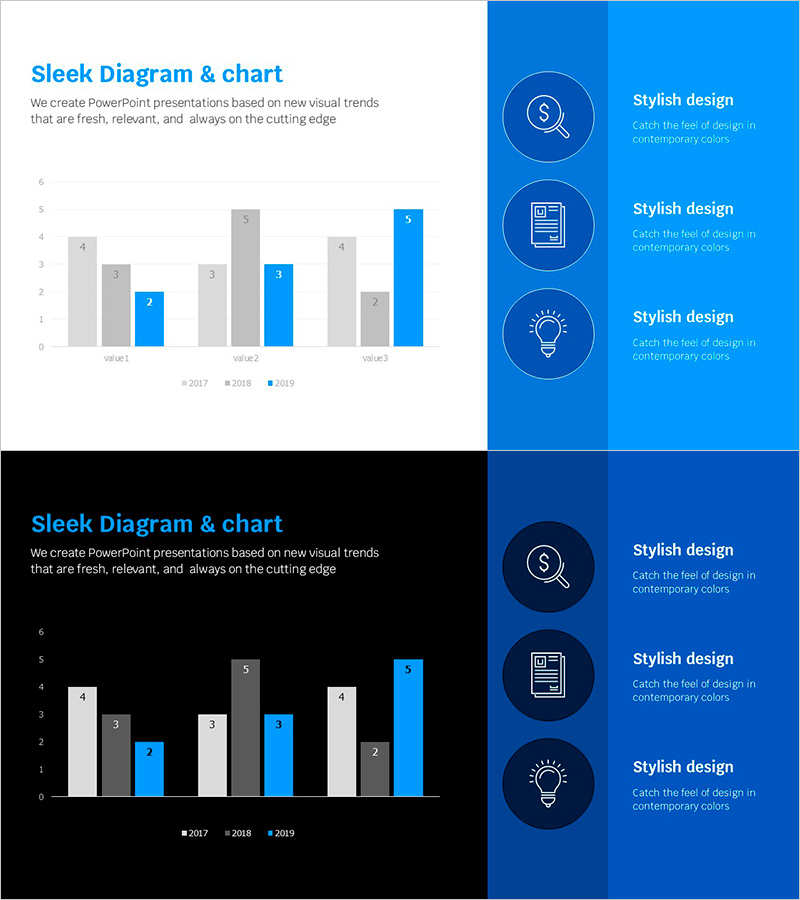
A grouped vertical bar chart PowerPoint slide designed to visualize business progress and performance metrics across multiple years and categories. The slide features a bright blue background with gray and blue bars that enable clear comparison of data by year and item. This presentation template displays data for three years (2017, 2018, 2019) and three value categories simultaneously, making it ideal for marketing strategy presentations, business goal achievement reports, and performance comparisons. The 16:9 widescreen format includes 2 slides with fully editable numbers and legends for flexible customization.
Usage Points
-
Main Usage
Effectively compare business performance data across multiple years and categories simultaneously, visualizing trends and progress metrics. Ideal for presenting marketing plan execution rates, quarterly goal achievement, regional sales performance, and product line revenue comparisons with multiple data series.
-
How to Use
Incorporate this slide into business strategy presentations, marketing performance reports, executive briefings, and quarterly results reviews. The bar heights and color coding intuitively convey data magnitude and category differences, allowing audiences to immediately grasp year-over-year changes and inter-item variations.
-
Recommended For
Marketing managers, business planning teams, executives, and sales directors presenting performance reports and strategic initiatives. Particularly valuable for quarterly and annual performance comparisons in management reports, business plan review meetings, and investor presentations where data credibility is essential.
-
Slide Structure
Two-slide set featuring grouped vertical bar charts: the first slide displays a bright blue background with 3-year × 3-category grouped bars, while the second uses a dark blue background with identical chart structure. Both slides include legends (2017, 2018, 2019) and Y-axis scales (0-6) to facilitate data interpretation and analysis.
Related Products
-

Plotting Paper Presentation Template Column Chart – Business Strategy Analysis
#Business Strategy #Market and Competitor Analysis #Graph
-

IT Service Business Progress and Outlook – Roadmap to Success
#Business Strategy #Market and Competitor Analysis #Graph
-

Identity Wide Template – Representative Introduction with Doughnut & Column Charts
#Business Strategy #Market and Competitor Analysis #Graph
-

Simple Circle Presentation Template for Column Chart – Clearly Demonstrating Business Performance
#Business Strategy #Graph #Financial Outlook & Expected Impact
