Infographic Design Wide Template – Solution Presentation
RJ0200064_13
- Last Update 04/17/2025
- File Size 0.2MB
- # of Slides 2
- File Format PPTX
- Slide Ratio 16:9
- Color
Keywords
About the Product
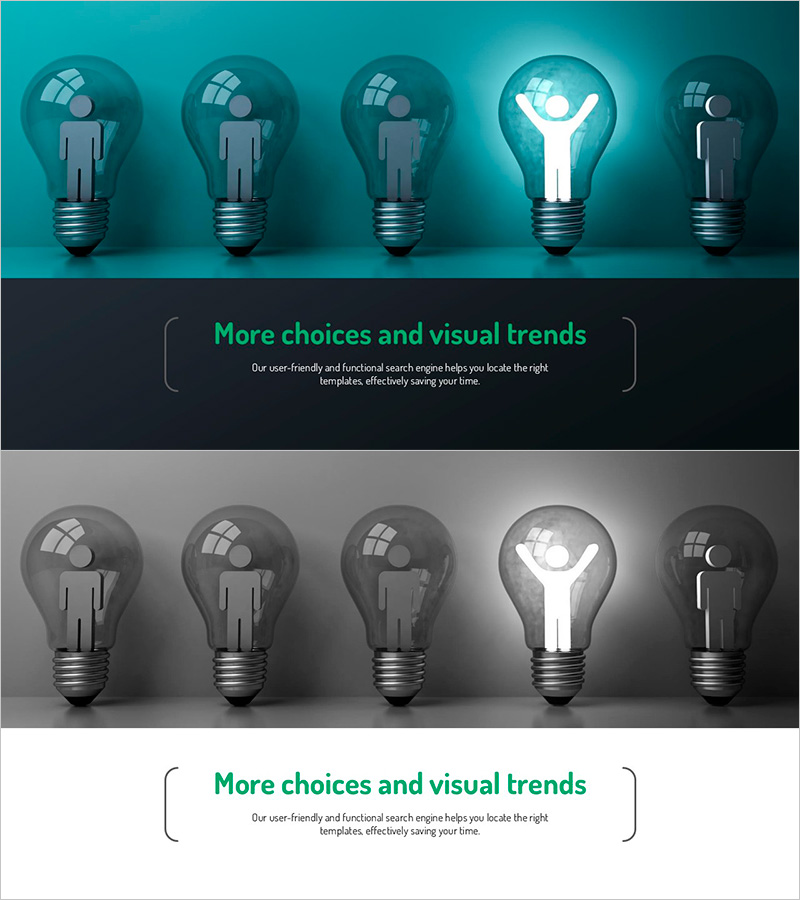
A 2-slide infographic PowerPoint presentation designed for R&D and innovation strategy presentations. This slide deck visualizes idea development stages, innovation levels, and solution comparisons using 5 lightbulb icons with human silhouettes and symbols inside each bulb. Two color options—turquoise gradient and grayscale—are included to match your presentation tone. Clear text input areas allow you to add titles, descriptions, and data instantly. The 16:9 widescreen format ensures compatibility with modern presentation environments and conference displays.
Usage Points
-
Main Usage
Visualize research and development innovation ideas, technology development stages, and solution comparisons using a 5-stage infographic layout. The lightbulb icons symbolize creativity and innovation, with each stage clearly differentiated to support decision-making and build team consensus on development priorities.
-
How to Use
Insert this slide into technology presentations, R&D reports, and innovation strategy decks when explaining idea development processes, technology roadmaps, or solution comparisons. Add stage names, responsible teams, key technologies, and expected outcomes to each bulb's text area. Select the color option (turquoise or grayscale) that matches your document's overall tone.
-
Recommended For
R&D departments, technology innovation teams, new business development units, consulting firms, and university research labs presenting technology development stages and innovation strategies. Ideal for executive briefings, investor pitches, academic presentations, and technology seminars where complex development processes need intuitive visual communication.
-
Slide Structure
2-slide set: top slide features turquoise gradient background with 5 lightbulb icons on the left and 2 text input areas on the right; bottom slide presents the same layout in grayscale. Each bulb functions as an independent input zone for titles, descriptions, and metrics, with the center bright bulb highlighting the priority solution or core technology.
Related Products
-

Core Insights Gleaned from Drug Experiment Analysis
#Operational Plan #Technical Approach #Mitigation Measures
-

Financial Services Development Plan – Effective Diagram Utilization
#Technical Approach #Diagram #Service Development Plan
-

Service Development Plan Goals – Cluster Diagram for Organized Execution
#Technical Approach #Diagram #Service Implementation Plan
-

Cluster Diagram Slide for Service Development Plan
#Technical Approach #Diagram #Service Development Plan
