Core Insights Gleaned from Drug Experiment Analysis
RB0400002_6
- Last Update 03/11/2025
- File Size 0.9MB
- # of Slides 2
- File Format PPTX
- Slide Ratio 4:3
- Color
Keywords
- #Content-Based Slides
- #Operational Plan
- #Technical Approach
- #Mitigation Measures
- #Research and Development
- #4:3
- #drug experiment analysis PowerPoint slide
- #drug experiment data visualization PPT
- #research development chart slide
- #experimental data comparison presentation
- #how to present drug analysis in PowerPoint
About the Product
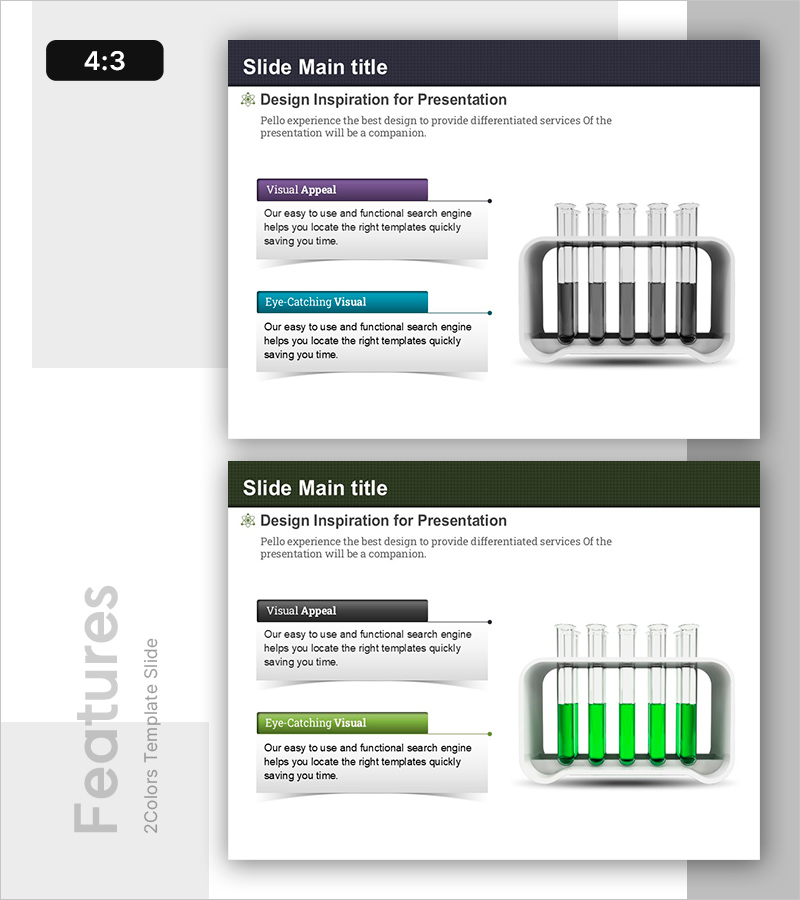
A PowerPoint slide designed to visually analyze drug experiment data and communicate core insights from research findings. The 2-slide set features a text-based overview with visual elements on the first slide, and a comparative chart-focused layout on the second slide for detailed data analysis. Dark background with purple and teal accent boxes creates clear information hierarchy, while the 3D graphic element on the right enhances data visualization credibility. Ideal for R&D presentations, technical reports, drug clinical trial results, and scientific analysis-driven presentations requiring immediate deployment.
Usage Points
-
Main Usage
This slide communicates core insights from drug experiment results through visual data representation. It strengthens scientific credibility during result comparison, interpretation, and conclusion phases, effectively persuading investors, partners, and internal decision-makers of research achievements and technical breakthroughs.
-
How to Use
Input experiment overview and key findings as text on the first slide, then populate the chart area on the second slide with actual experimental data. Use purple and teal accent boxes to highlight critical points, and leverage the 3D graphic element to reinforce data credibility. Ready for immediate use in drug clinical trials, new drug development presentations, and technical seminars.
-
Recommended For
Pharmaceutical companies, biotech research institutes, university research teams, clinical trial coordinators, and R&D department staff presenting drug experiment results. Suitable for investment pitch decks, academic presentations, internal technical reports, and regulatory agency submissions where scientific credibility is paramount.
-
Slide Structure
2-slide format with the first slide containing title area, two explanatory text sections, and a 3D visualization element on the right. The second slide features title, two text explanation sections on the left, and a comparative chart on the right with five data points, optimized for quantitative analysis of experimental results.
Related Products
-

Infographic Design Wide Template – Solution Presentation
#Operational Plan #Technical Approach #Mitigation Measures
-

Case Studies and Examples of Closed Diagrams - Technology Inspiration
#Technical Approach #Diagram #Implementation Case Studies
-

In-depth Analysis Diagrams & Charts – Insightful Technical Analysis
#Technical Approach #Market and Competitor Analysis #Diagram
-

Three Intra-Molecular Analytical Perspectives – Slides for Innovative R&D
#Technical Approach #Diagram #Research and Development
