Color Theme Presentation Template Diagram – Visualizing Business Management Flow
RJ0200043_23
- Last Update 04/10/2025
- File Size 0.3MB
- # of Slides 2
- File Format PPTX
- Slide Ratio 16:9
- Color
Keywords
- #Content-Based Slides
- #Design-Based Slides
- #Company Introduction
- #Business Management
- #Diagram
- #History
- #Implementation Schedule
- #Flow
- #Linear Flow
- #16:9
- #timeline diagram PowerPoint
- #flow chart presentation slide
- #5-stage process diagram
- #business progress visualization
- #project milestone PPT slide
About the Product
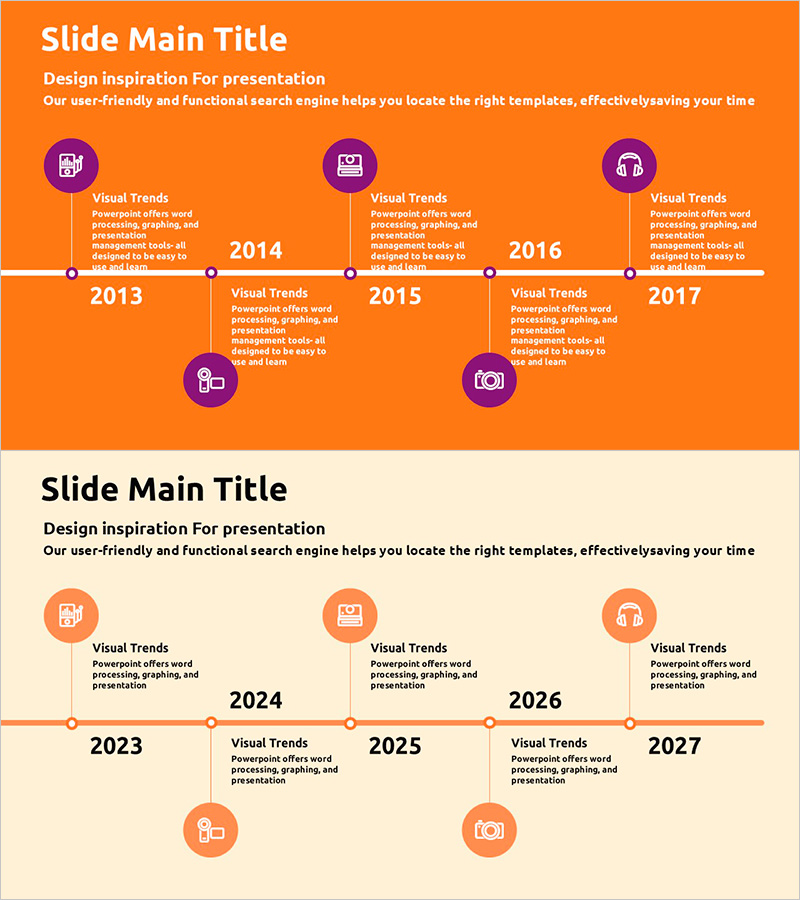
A timeline diagram PowerPoint slide that visualizes business processes and temporal progression across five years (2013–2017). The design features an orange background with purple circular icons and white connecting lines representing sequential stages. Each node includes text areas for entering project milestones, business objectives, organizational changes, or key achievements. Optimized for 16:9 widescreen format in a 2-slide set, this presentation template is ideal for business plans, strategy reports, and progress updates where chronological flow is essential. All elements are fully editable, allowing customization of colors, icons, and text to match your brand identity and content requirements.
Usage Points
-
Main Usage
Displays business progression, project timelines, organizational development stages, or product launch schedules across a horizontal time axis. Each node's text area accommodates specific achievements, goals, or milestones, enabling clear communication of sequential progress to stakeholders and decision-makers.
-
How to Use
Insert into the 'Implementation Strategy' section of business plans, 'Performance Summary' in annual reports, or 'Roadmap' slides in investor presentations. Customize icons to match your industry or project type, add descriptive text for each stage, and adjust the color scheme to align with corporate branding guidelines.
-
Recommended For
Business strategists, project managers, marketing planners, and executives presenting medium to long-term plans. Suitable for explaining startup growth phases, corporate business diversification, product development cycles, government policy implementation timelines, and organizational transformation initiatives.
-
Slide Structure
2-slide set with horizontal timeline axis (white line) as the central reference. Five nodes (purple circular icons) are positioned alternately above and below the timeline, each with connecting lines and year labels (2013, 2014, 2015, 2016, 2017). Text boxes adjacent to each node allow detailed descriptions of stage-specific information.
Related Products
-

Process Diagram Representing Design Changes Over Time – Vision for the Future
#Company Introduction #Business Management #Diagram
-

Horizontal Timeline Slide – Year-by-Year Business Roadmap
#Company Introduction #Business Strategy #Business Management
-

Green Blue Timeline Slide – Dynamic Business Roadmap
#Company Introduction #Business Management #Diagram
-

History Slide in Brown and Green – Effective Company Introduction
#Company Introduction #Business Management #Diagram
