Four Color Infographic Template for Market Analysis
RJ0200037_21
- Last Update 04/08/2025
- File Size 0.2MB
- # of Slides 2
- File Format PPTX
- Slide Ratio 16:9
- Color
Keywords
- #Content-Based Slides
- #Design-Based Slides
- #Market and Competitor Analysis
- #Marketing Plan and Strategy
- #Other
- #Market Share
- #Target Market Strategy
- #Map
- #16:9
- #geographic map PowerPoint slide
- #market share comparison presentation
- #regional analysis infographic
- #three-region data visualization
- #global market analysis slides
About the Product
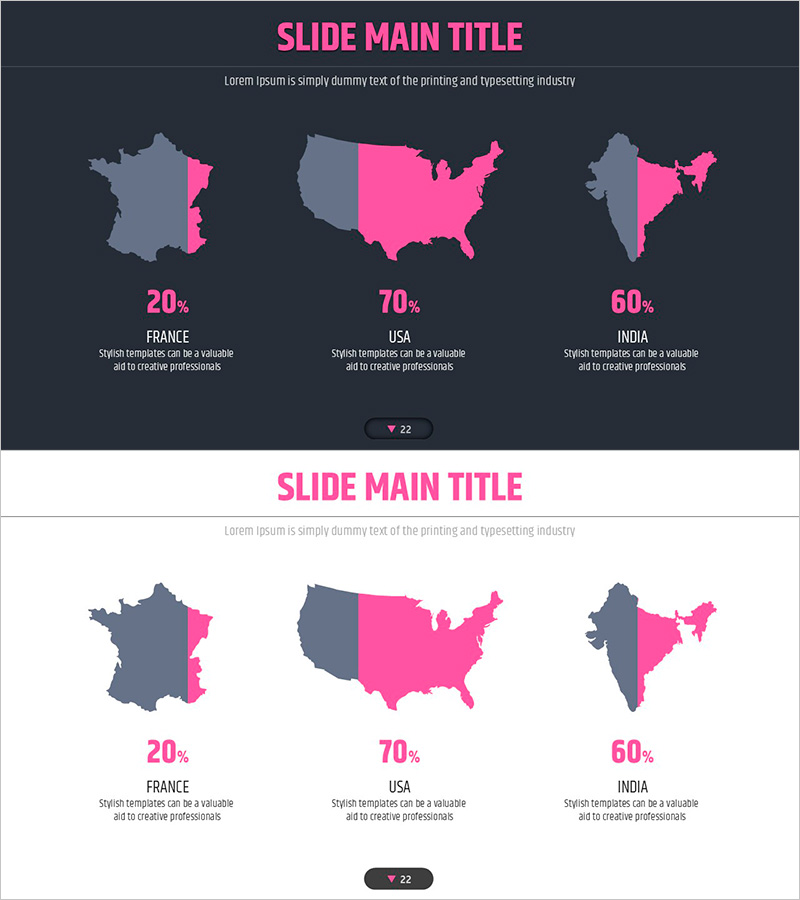
A map-based infographic PowerPoint slide designed for global market analysis and regional competitive comparison. The slide visualizes market share across three regions (France, USA, India) with pink accent colors on a dark background, including dedicated text description areas for each region. The 2-slide set provides both dark and light theme layouts, allowing you to select the design that best fits your presentation environment. Ideal for marketing strategy presentations, target market analysis, investor pitches, and regional performance reports.
Usage Points
-
Main Usage
This slide enables you to compare and visualize regional market share, sales performance, and customer distribution across global markets using geographic maps. It supports investor presentations, marketing strategy meetings, and executive reports by making regional performance instantly clear.
-
How to Use
Enter actual market share percentages, revenue figures, or customer counts in the percentage fields and text areas next to each regional map. Choose between the dark theme (for projector presentations) or light theme (for printed materials) based on your presentation environment. All colors and data are fully editable.
-
Recommended For
Marketing managers, business development teams, investor relations professionals, and executives presenting regional market performance. Particularly effective for multinational companies, global expansion strategy presentations, and regional sales performance analysis reports.
-
Slide Structure
The slide features a title area at the top, three regional maps in the center (each highlighted in pink), percentage figures and region labels below each map, and descriptive text areas at the bottom. The information hierarchy follows a comparative regional structure, enabling viewers to instantly grasp relative market sizes.
Related Products
-

Strategy for Global Growth – Target Market Strategy
#Company Introduction #Marketing Plan and Strategy #Other
-

Description of Global Target Country Strategy
#Company Introduction #Marketing Plan and Strategy #Other
-

Analysis of the Region on the Plate – Marketing Plans and Strategies
#Market and Competitor Analysis #Marketing Plan and Strategy #Other
-

Target Country Strategy Description Slide
#Company Introduction #Marketing Plan and Strategy #Other
