Visual Presentation Using Maps – Comprehensive Data Visualization
RJ0600098_26
- Last Update 07/17/2025
- File Size 0.2MB
- # of Slides 2
- File Format PPTX
- Slide Ratio 16:9
- Color
Keywords
- #Content-Based Slides
- #Design-Based Slides
- #Operational Plan
- #Marketing Plan and Strategy
- #Text Box
- #Other
- #Business Support Plan
- #Target Market Strategy
- #Distribution Strategy
- #Rectangle Text Box
- #Map
- #16:9
- #map PowerPoint slide
- #global network diagram
- #regional connectivity visualization
- #geographic data slide
- #international business map PPT
About the Product
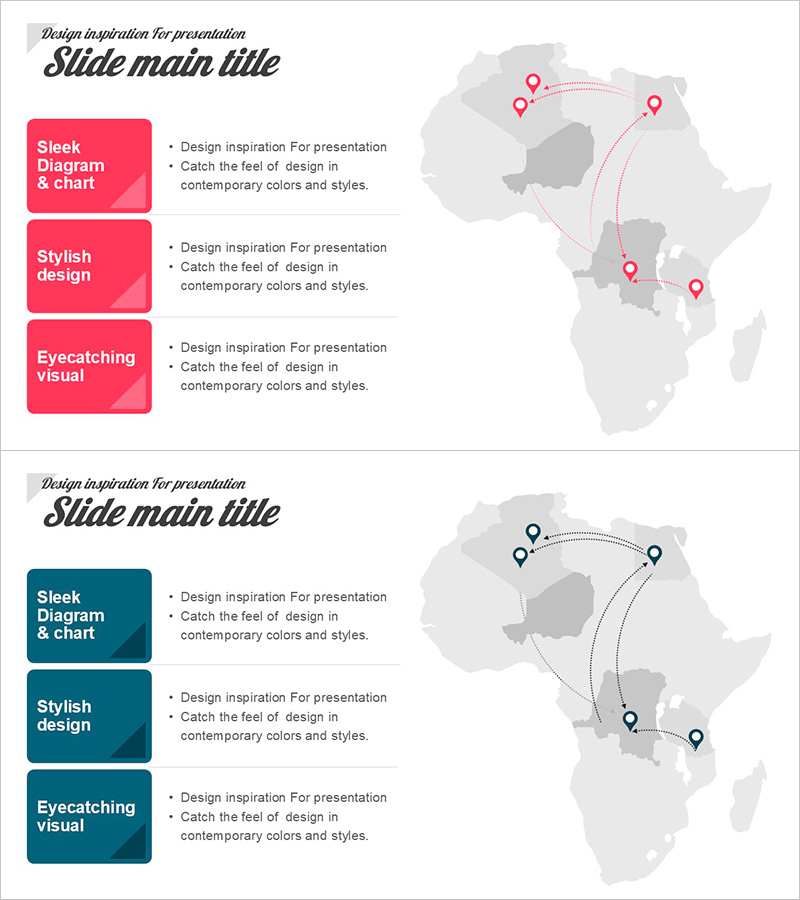
A PowerPoint slide visualizing regional connectivity across an Africa-centered map with two color variants: pink and dark blue. The layout features three text boxes on the left (Sleek Diagram & chart, Stylish design, Eyecatching visual) paired with a geographic map on the right, where pink connection lines and location pointers illustrate inter-regional relationships. Ideal for presenting global expansion, international partnerships, and cross-border business networks. The slide is fully editable and ready for immediate use in presentations and business reports.
Usage Points
-
Main Usage
Visualizes international networks, regional business expansion, and partnership relationships across Africa and global markets. The map-based pointer system and connection lines clearly communicate inter-regional interactions, making it highly effective for investor pitches, partner briefings, and stakeholder communications.
-
How to Use
Deploy in company overview presentations under the global network section, business expansion strategy decks, or international partnership introductions. Customize the left-side text boxes with region-specific business details and performance metrics, then adjust map pointers and connection lines to match your actual network structure.
-
Recommended For
Recommended for executives, business development teams, and marketing professionals at global enterprises presenting international expansion strategies, regional performance, and partnership networks. Suitable for investor relations presentations, annual business reports, and international conference materials.
-
Slide Structure
Two-slide set offering pink and dark blue color variants. Each slide divides into a left text box area (three editable sections) and a right geographic visualization area (map, pointers, connection lines), allowing independent customization of content and visual elements. Optimized for 16:9 widescreen format in modern presentation environments.
Related Products
-

Orange Purple Green Map for Market Strategy Visualization
#Marketing Plan and Strategy #Other #Target Market Strategy
-

Structure Presentation Template for the United States – Marketing and Distribution Strategy
#Marketing Plan and Strategy #Other #Target Market Strategy
-

Enhance Market Strategy with Coffee Global Map
#Marketing Plan and Strategy #Other #Target Market Strategy
-

Visualizing 3 Recent Market Points – Strategic Insights
#Marketing Plan and Strategy #Other #Target Market Strategy
