Systematic Nested Diagram – Business Strategy Visualization
RB0600020_9
- Last Update 03/14/2025
- File Size 0.3MB
- # of Slides 2
- File Format PPTX
- Slide Ratio 4:3
- Color
Keywords
- #Content-Based Slides
- #Design-Based Slides
- #Business Strategy
- #Technical Approach
- #Diagram
- #Implementation Framework
- #Service Implementation Plan
- #Cluster
- #Combination Diagram
- #Chain Diagram
- #4:3
- #nested diagram PowerPoint
- #Venn diagram slide template
- #3-circle diagram presentation
- #cluster diagram PowerPoint
- #business strategy visualization slide
About the Product
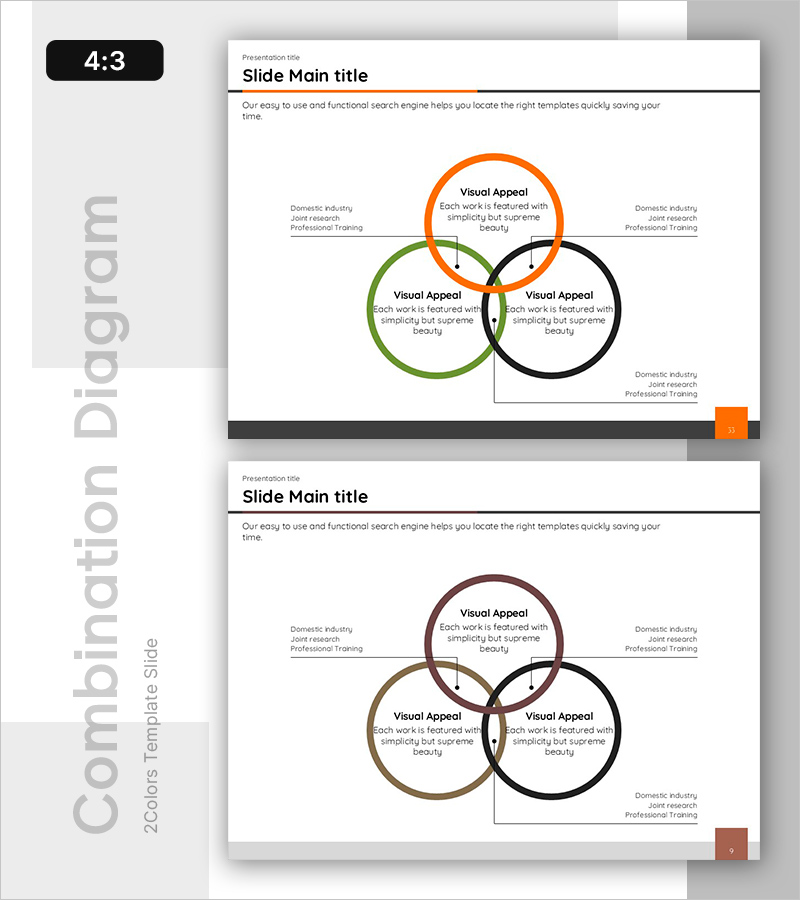
A Venn diagram-style PowerPoint slide featuring three overlapping circles in orange, green, and black to highlight intersection areas and shared elements. The left and right sides display related information (domestic industry, joint research, professional training) in text format, clearly conveying multi-layered relationships. This presentation slide is ideal for explaining complex relationships such as business strategy visualization, inter-organizational collaboration structures, and product feature comparisons in professional presentations.
Usage Points
-
Main Usage
Optimized for visually representing intersection relationships among three or more elements. Effectively highlights collaboration areas between multiple departments or teams in business strategy, or simultaneously explains multi-layered product characteristics (features, value, market positioning).
-
How to Use
Edit the text inside each circle to match your content. Modify the left and right side descriptions to fit your presentation context. Colors can remain as the existing three-color scheme or be changed to match your organization's brand colors.
-
Recommended For
Ideal for executives, planning teams, and marketing departments in strategy meetings, business briefings, and product launch presentations. Also useful for educational seminars and training materials explaining complex concepts.
-
Slide Structure
4:3 aspect ratio with 2 slides. Each slide features a Venn diagram layout with three overlapping circles (approximately 120px diameter). Title area at the top, three-circle intersection diagram in the center, and text description areas on the left and right sides.
Related Products
-

Carbon Neutral Profit Forecast and Expected Effect Diagram
#Technical Approach #Diagram #Service Implementation Plan
-

Deer and Circular Diagram – Vision for Business Execution
#Business Strategy #Technical Approach #Diagram
-

Food Ingredient Illustration Circular Diagram – Business Strategy
#Business Strategy #Technical Approach #Diagram
-

Sleek Presentation Template Emphasizing Business Context
#Business Strategy #Operational Plan #Technical Approach
