Abstract Pattern Step Diagram – Business Strategy Visualization
RJ0200033_20
- Last Update 04/07/2025
- File Size 0.5MB
- # of Slides 2
- File Format PPTX
- Slide Ratio 16:9
- Color
Keywords
- #Content-Based Slides
- #Design-Based Slides
- #Business Strategy
- #Diagram
- #Step-by-Step Schedule Plan
- #Business Direction
- #Flow
- #Linear Flow
- #16:9
- #3-step arrow diagram PowerPoint
- #step-by-step process flow slide
- #business process diagram template
- #business strategy visualization PowerPoint
- #arrow diagram slide design
About the Product
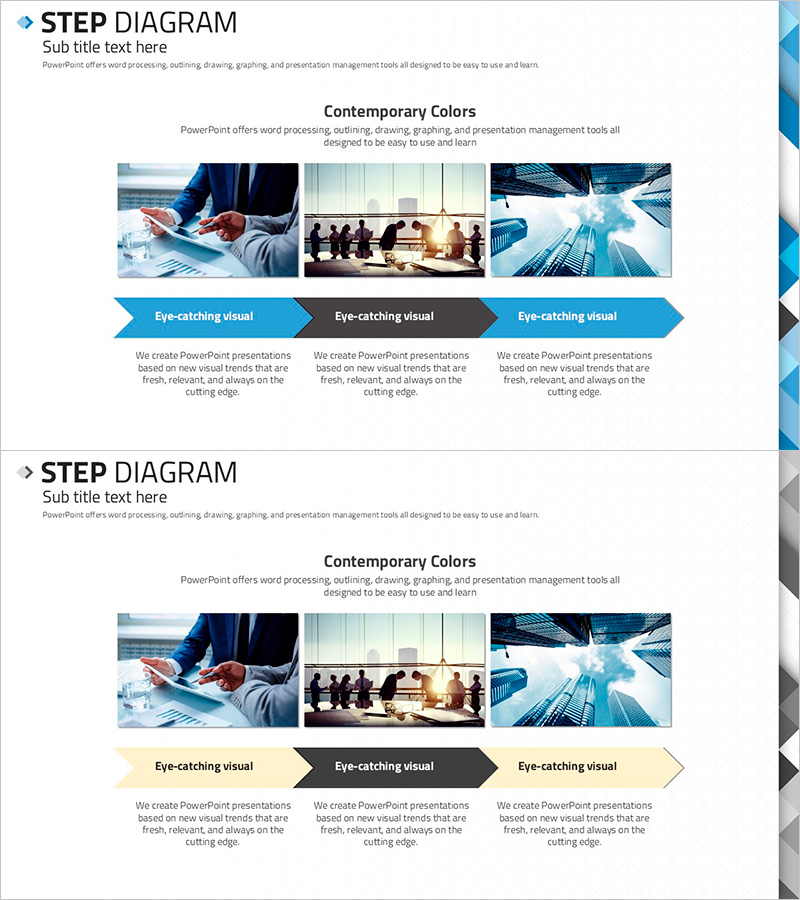
A 3-step arrow diagram PowerPoint slide designed to visualize business strategy progression and process flows. Features a contemporary color palette combining blue, gray, and beige tones suitable for professional business presentations. Each step includes dedicated image and text areas to clearly communicate sequential processes. Ideal for business plans, marketing strategies, project timelines, and organizational presentations. The 2-slide set offers arrow direction and color variations, allowing you to select the design that best matches your document context and audience.
Usage Points
-
Main Usage
Communicate business strategy progression, marketing processes, and project timelines through three distinct sequential steps. Arrow direction intuitively shows progression order, while combined image and text areas enhance audience comprehension and engagement with your strategic narrative.
-
How to Use
Enter step names, objectives, and responsible departments in text areas. Insert representative photos or icons in image sections. Use blue-toned slide for technology and IT sectors, gray for finance and consulting, and beige for marketing and brand presentations to maximize visual impact.
-
Recommended For
Recommended for executives, planners, and marketing professionals preparing business plans, strategy presentations, and project proposals. Effective for progress update meetings, new business initiative launches, organizational restructuring announcements, and process improvement briefings.
-
Slide Structure
2-slide set with each slide featuring 3 arrow nodes arranged horizontally. Top section contains 3 image areas, bottom section contains 3 text description areas, creating balanced visual-information layout. First slide uses blue arrows; second slide presents gray and beige arrow variations for design flexibility.
Related Products
-

Stylish Design Inspired Presentation Template
#Business Strategy #Diagram #Step-by-Step Schedule Plan
-

Direction of Fountain Pen Business Promotion – Effective Step-by-Step Plan
#Business Strategy #Diagram #Step-by-Step Schedule Plan
-

Business Step by Step Schedule Planning Process Diagram
#Business Strategy #Diagram #Step-by-Step Schedule Plan
-

Phased Development Strategy Presentation Template
#Business Strategy #Diagram #Step-by-Step Schedule Plan
