Modern Business Presentation Template Project List
RJ0200028_6
- Last Update 04/05/2025
- File Size 6.8MB
- # of Slides 2
- File Format PPTX
- Slide Ratio 16:9
- Color
Keywords
About the Product
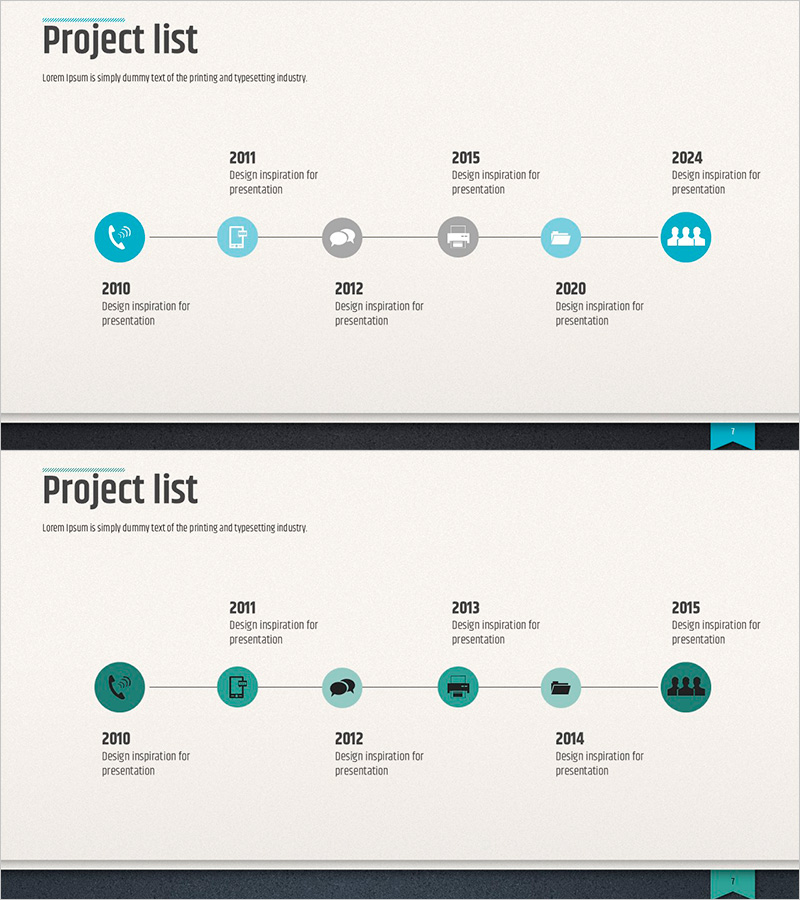
A linear timeline diagram PowerPoint slide that visualizes project progression in chronological order. Featuring 2 layout variations with 6 connected nodes in a horizontal flow structure, this presentation slide clearly illustrates project phases and milestones. The design uses teal and gray-toned icons to intuitively convey the meaning of each stage, optimized for 16:9 widescreen format. Ideal for business presentations including project schedules, product development roadmaps, marketing campaign timelines, and strategic initiatives. Each node includes dedicated text areas for detailed descriptions, making it easy to customize for various business contexts.
Usage Points
-
Main Usage
This linear timeline diagram expresses project progression in chronological sequence with 6 connected nodes flowing left to right. It clearly communicates continuity and sequential relationships between stages, making it ideal for representing time-based information such as business schedules, product development roadmaps, marketing campaign timelines, and organizational transformation processes.
-
How to Use
Enter timeline information (years, quarters, milestones) in each node and describe key activities or achievements in the text area below each icon. Choose between 2 layout options: alternating top-bottom arrangement or single-row horizontal arrangement based on your slide design. Colors and icons can be customized to match each stage's characteristics and your presentation theme.
-
Recommended For
Executives, project managers, marketing professionals, and strategic planning teams use this slide when reporting business progress, product development schedules, and market expansion plans. Highly effective for investor presentations (IR), business plans, quarterly performance reports, and strategic announcements where timeline emphasis is critical.
-
Slide Structure
2-slide set. First slide features 6 nodes in alternating top-bottom arrangement (3 above, 3 below) connected by a timeline. Second slide displays 6 nodes in a single horizontal row. Each node combines a teal or gray-toned icon with a text input area, and connecting lines clearly show the sequential relationship between nodes.
Related Products
-

Business Step-by-Step History Diagram – Systematic Flow and Clear Information Delivery
#Company Introduction #Diagram #History
-

Infographic Design Wide Template History – Visualizing Company Growth
#Company Introduction #Diagram #History
-

Circular Gradient Wide Template History
#Company Introduction #Operational Plan #Diagram
-

Introduction to Company History – Visualizing with Linearity and Clusters
#Company Introduction #Operational Plan #Diagram
