Circle Diagram Slide for Visualizing Business Plan
RJ0200027_31
- Last Update 04/05/2025
- File Size 1.5MB
- # of Slides 2
- File Format PPTX
- Slide Ratio 16:9
- Color
Keywords
- #Content-Based Slides
- #Design-Based Slides
- #Business Introduction
- #Business Management
- #Diagram
- #Business Areas
- #Implementation Plan
- #Spread
- #Decentralized Diagram
- #16:9
- #circular diagram PowerPoint
- #4-stage cycle slide
- #business process diagram
- #cycle diagram template
- #how to create circular diagram in PowerPoint
About the Product
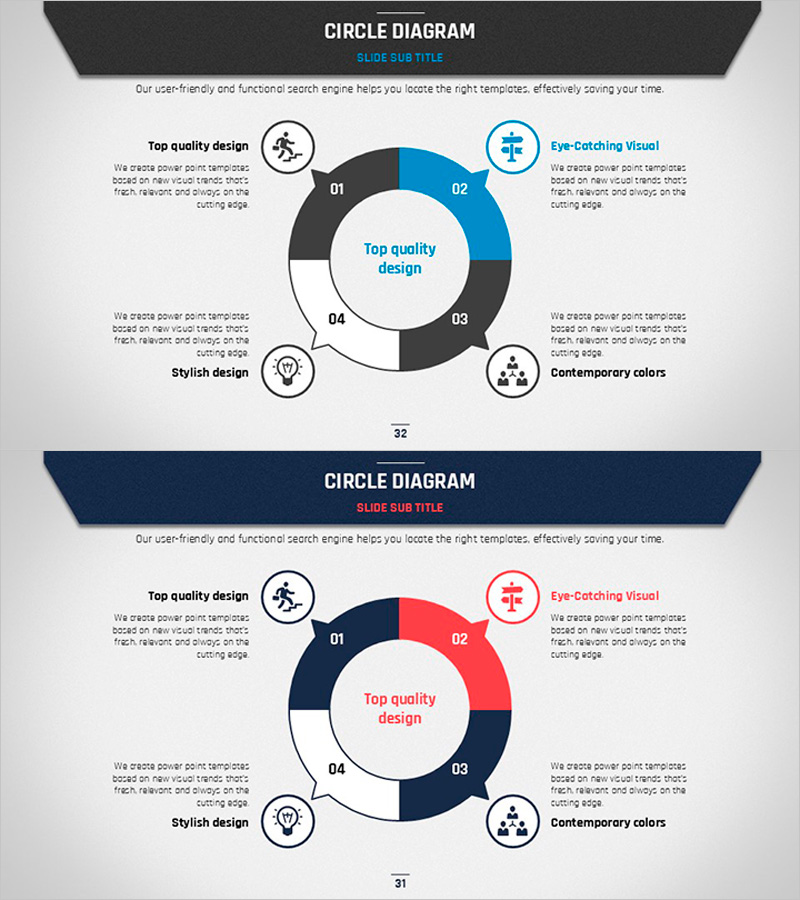
A 4-stage circular diagram PowerPoint slide designed to visualize business processes and strategic cycles. This 2-slide set features a dark gray and blue two-tone color scheme with a central core message surrounded by four rotating stages. Each stage includes an icon and text area for detailed descriptions, making it ideal for presenting business plans, operational cycles, improvement processes, and repetitive workflows. Available in 16:9 widescreen PPTX format, fully editable and ready to integrate into presentations and planning documents.
Usage Points
-
Main Usage
Effectively visualizes repetitive and cyclical business flows such as operational processes, improvement cycles, strategic execution phases, and workflow stages. The central core message is surrounded by four interconnected stages, allowing you to communicate relationships and sequence intuitively to your audience.
-
How to Use
Enter your core topic in the central text area and add process stage names and descriptions in the four surrounding sections. Icons can be customized to match each stage's characteristics, and colors are fully adjustable to align with your corporate brand. Insert into presentations, planning documents, reports, and other business materials.
-
Recommended For
Ideal for business planning, operational process explanation, quality improvement cycles, marketing campaign phases, and project management workflows. Recommended for executives, planners, marketers, and project managers. Suitable for internal training materials and external presentations.
-
Slide Structure
2-slide set with each slide featuring a central circular core and four stage sections. First slide uses dark gray and blue tones; second slide offers dark blue and red variations. Each stage includes a number, icon, and text input area, optimized for 16:9 widescreen format.
Related Products
-

Learning Area Expansion Diagram – Visualizing Business Field Growth
#Company Introduction #Business Introduction #Diagram
-

Business Science Diffusion Diagram – Non-Central Connection
#Company Introduction #Business Introduction #Diagram
-

Study Flow Diagram - Linear and Diverging
#Business Management #Operational Plan #Diagram
-

Smart Home Service Area Diagram – Business Introduction and Areas
#Company Introduction #Business Introduction #Diagram
