Global Business Activity Areas Diagram - Center of Business Vision and Strategy
RM0300022_6
- Last Update 02/13/2025
- File Size 0.3MB
- # of Slides 2
- File Format PPTX
- Slide Ratio 16:9
- Color
Keywords
- #Content-Based Slides
- #Design-Based Slides
- #Business Introduction
- #Business Vision and Strategy
- #Diagram
- #Business Areas
- #Business Strategy
- #Spread
- #Decentralized Diagram
- #16:9
- #radial diagram PowerPoint slide
- #4-value diagram presentation
- #center-focused diagram
- #business area diagram
- #vision strategy PowerPoint template
About the Product
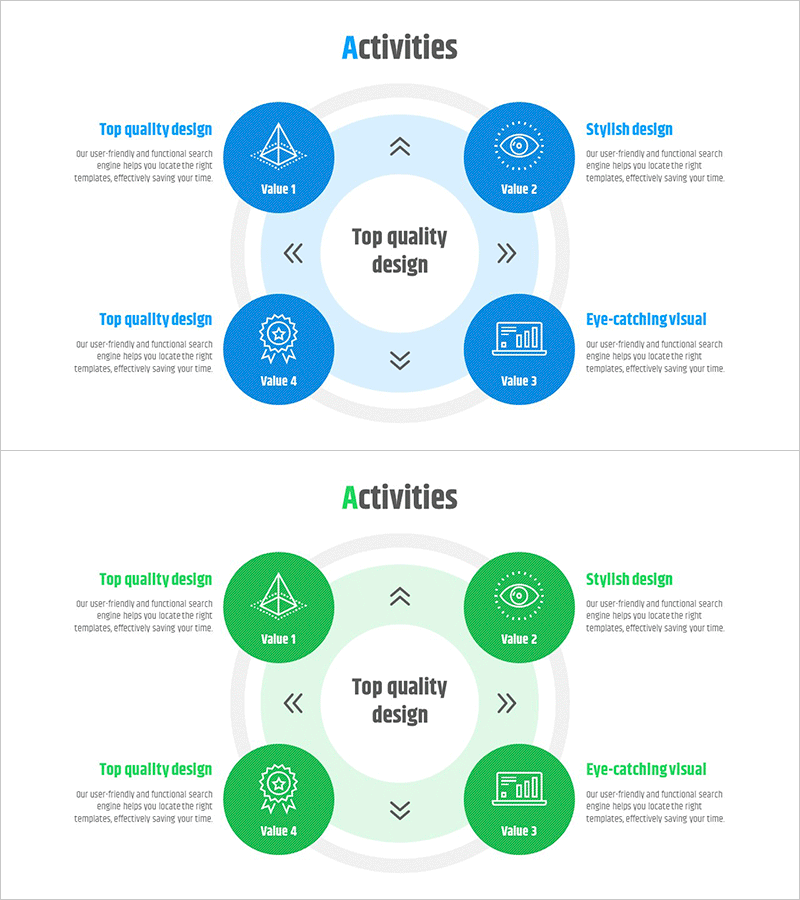
A radial diagram PowerPoint slide presenting global business activity areas through four core values. The diagram features a central message 'Top quality design' with four symmetrically positioned nodes (Value 1 through Value 4), each containing an icon and descriptive text. Designed in blue and green dual-tone color scheme, this slide is ideal for corporate vision and strategy presentations. Available in 16:9 widescreen format and PPTX file type for immediate editing. Perfect for defining business domains, illustrating organizational value systems, and explaining strategic frameworks.
Usage Points
-
Main Usage
Visualizes four core values, business domains, or strategic elements radiating from a central unified message. Effectively communicates organizational vision, explains business strategy, and demonstrates value system alignment across departments.
-
How to Use
Enter your core message in the central circle and populate each of the four nodes with corresponding values, domains, or strategic initiatives. Icons can be customized to represent each category, and colors are fully adjustable to match your corporate brand guidelines.
-
Recommended For
Executive presentations, strategic planning sessions, investor relations materials, company vision sharing meetings, and organizational restructuring communications. Particularly effective for multinational corporations presenting diverse business domains globally.
-
Slide Structure
Two-slide set. Slide 1: Blue-tone radial diagram with four value nodes (Value 1-4), central message hub, and four icons arranged symmetrically. Slide 2: Identical structure in green-tone color scheme. Each node is circular and positioned equidistant from center.
Related Products
-

Market Share Donut Pie Chart – Business Strategy and Vision
#Business Introduction #Business Vision and Strategy #Diagram
-

Area Diagram of Data Analysis – Visualizing Business Strategies
#Business Introduction #Business Vision and Strategy #Diagram
-

Academic Icons and Centerless Diffusion Diagram – Innovative Business Strategy
#Business Introduction #Business Vision and Strategy #Diagram
-

Business Goal Icon Diagram – An Effective Tool for Communicating Business Vision
#Business Introduction #Business Vision and Strategy #Diagram
