Business Plan Template with Area Chart for Market Analysis
RJ0200027_14
- Last Update 04/05/2025
- File Size 1.5MB
- # of Slides 2
- File Format PPTX
- Slide Ratio 16:9
- Color
Keywords
- #Content-Based Slides
- #Design-Based Slides
- #Market and Competitor Analysis
- #Marketing Plan and Strategy
- #Graph
- #Other
- #Market Analysis
- #Marketing Objectives
- #16:9
- #area chart PowerPoint slide
- #area graph presentation template
- #market analysis chart slide
- #comparative data visualization PPT
- #marketing metrics dashboard
About the Product
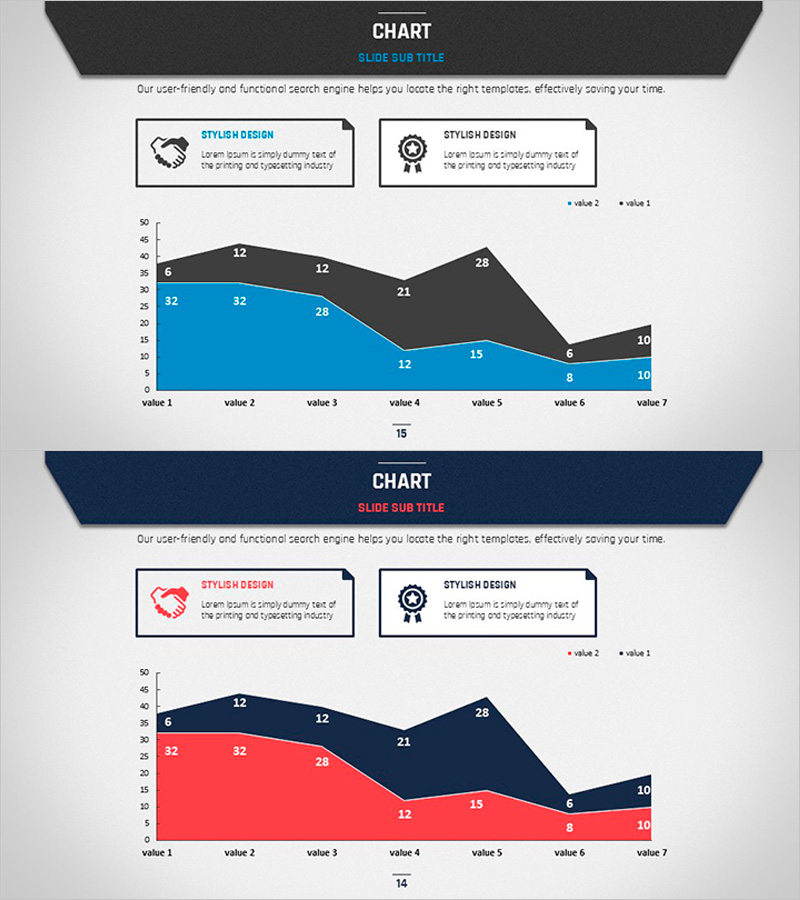
An optimized PowerPoint slide set featuring area charts for market analysis and marketing strategy presentations. This 2-slide collection offers both blue and red color versions, each visualizing 7 data points across 2 series for comparative analysis. Icon boxes at the top highlight key insights, while clear numerical labels enhance data readability. Fully editable and ready to use in business plans, investor pitches, quarterly performance reports, and competitive analysis decks.
Usage Points
-
Main Usage
Visualize time-series data trends and comparative metrics across two data series for market analysis and marketing strategy discussions. The stacked area effect simultaneously communicates overall scale and individual series progression, strengthening decision-making support.
-
How to Use
Enter key insights in the icon boxes at the top, then replace chart data with your actual figures. Choose the blue version for trust and stability messaging, or the red version for growth and alert messaging based on your presentation context.
-
Recommended For
Marketing managers, strategy planners, financial analysts, and executives presenting quarterly performance, market share trends, customer acquisition metrics, or competitive benchmarking. Ideal for investor presentations, executive briefings, and strategic planning sessions.
-
Slide Structure
Each slide contains a title and subtitle area, two icon explanation boxes, and one area chart. The chart displays 7 time points with 2 data series, featuring clear numerical labels and a legend for optimal data comprehension and professional presentation impact.
Related Products
-

Business Achievement Goals Diagram – Market Analysis and Marketing Strategy
#Market and Competitor Analysis #Marketing Plan and Strategy #Graph
-

Stack Bar Chart Map for Market and Competitor Analysis
#Market and Competitor Analysis #Marketing Plan and Strategy #Graph
-

Mint Green Mixed Graph – Market Status Analysis
#Market and Competitor Analysis #Graph #Other
-

Industrial Data Report for Market Analysis Slides
#Market and Competitor Analysis #Diagram #Graph
