Business Forest Wide Template Diagram12 – Operational and Technical Strategy
RJ0200026_33
- Last Update 04/04/2025
- File Size 0.1MB
- # of Slides 2
- File Format PPTX
- Slide Ratio 16:9
- Color
Keywords
- #Content-Based Slides
- #Design-Based Slides
- #Operational Plan
- #Technical Approach
- #Diagram
- #Business Processes
- #Service Operation Plan
- #Flow
- #Circular Flow
- #16:9
- #circular diagram PowerPoint
- #4-step cycle diagram
- #process flow PowerPoint slide
- #operational strategy diagram
- #technical strategy PPT
- #business process diagram PowerPoint
About the Product
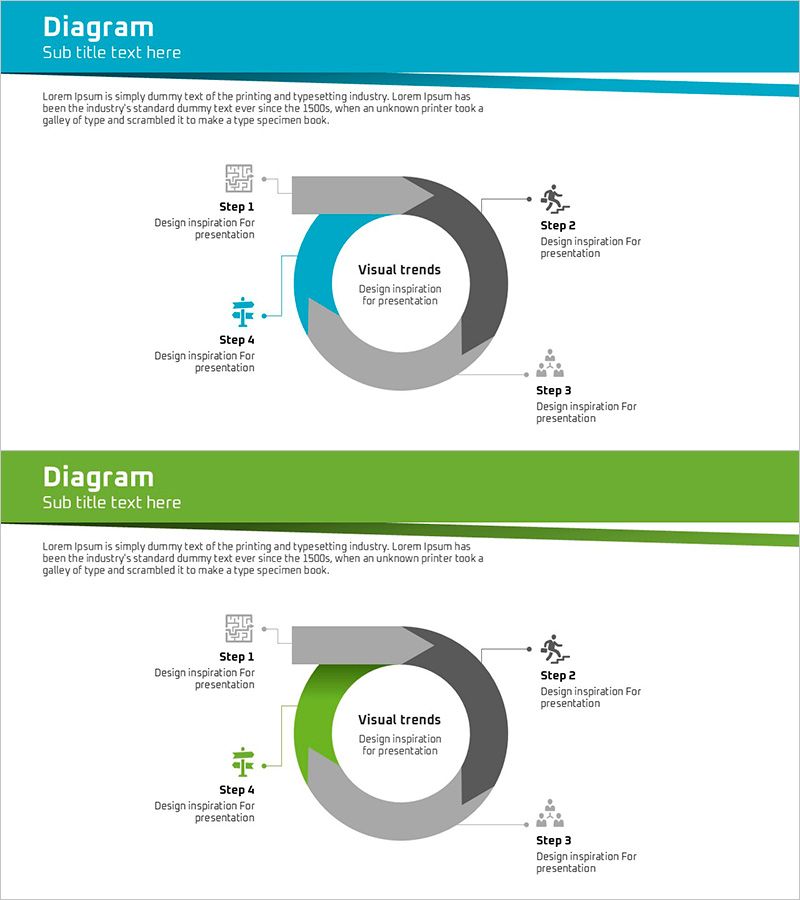
A 4-step circular diagram PowerPoint slide designed to visualize operational and technical strategies. The teal and gray dual-tone color scheme emphasizes the central message, with icons and text labels positioned at each stage to clearly represent process flow. The 2-slide set adapts to various presentation scenarios, optimized in 16:9 widescreen format for modern projectors and digital displays. Provided in fully editable PPTX format, allowing you to customize text and colors freely to match your organization's branding and messaging requirements.
Usage Points
-
Main Usage
Optimized for expressing repetitive workflows such as operational planning, technical strategy, process improvement, and cycle management. The 4-stage circular structure centered on a core concept effectively communicates interconnectedness between stages and continuous improvement processes.
-
How to Use
Use in executive reports, strategic planning presentations, team meetings, and project kickoff sessions to explain operational approaches and technology roadmaps. Modify stage labels and icons to match your organization's actual processes and use as presentation material.
-
Recommended For
Recommended for IT departments, operations management teams, strategic planning divisions, consulting firms, and manufacturing companies requiring process improvement and cyclical management. Particularly effective for explaining PDCA cycles, continuous improvement initiatives, and quality management frameworks.
-
Slide Structure
Four nodes arranged clockwise around a central 'Visual Trends' text box, labeled Step 1 through Step 4. A teal-colored highlight indicates the current stage while gray areas represent remaining stages. Arrows and icons clarify progression direction. The 2-slide version presents different color combinations for visual variety.
Related Products
-

Diffusion Diagram without Center – Business Operation Flow
#Operational Plan #Technical Approach #Diagram
-

App Payment Service Operation Plan Diagram
#Operational Plan #Technical Approach #Diagram
-

Cognitive Process Diagram – Cluster-Based Operational Plan
#Operational Plan #Technical Approach #Diagram
-

Process Diagram of a Hardwood Background
#Business Strategy #Technical Approach #Diagram
