Business Forest Wide Template Diagram – Business Strategy and Quality Assurance
RJ0200026_24
- Last Update 04/04/2025
- File Size 0.1MB
- # of Slides 2
- File Format PPTX
- Slide Ratio 16:9
- Color
Keywords
About the Product
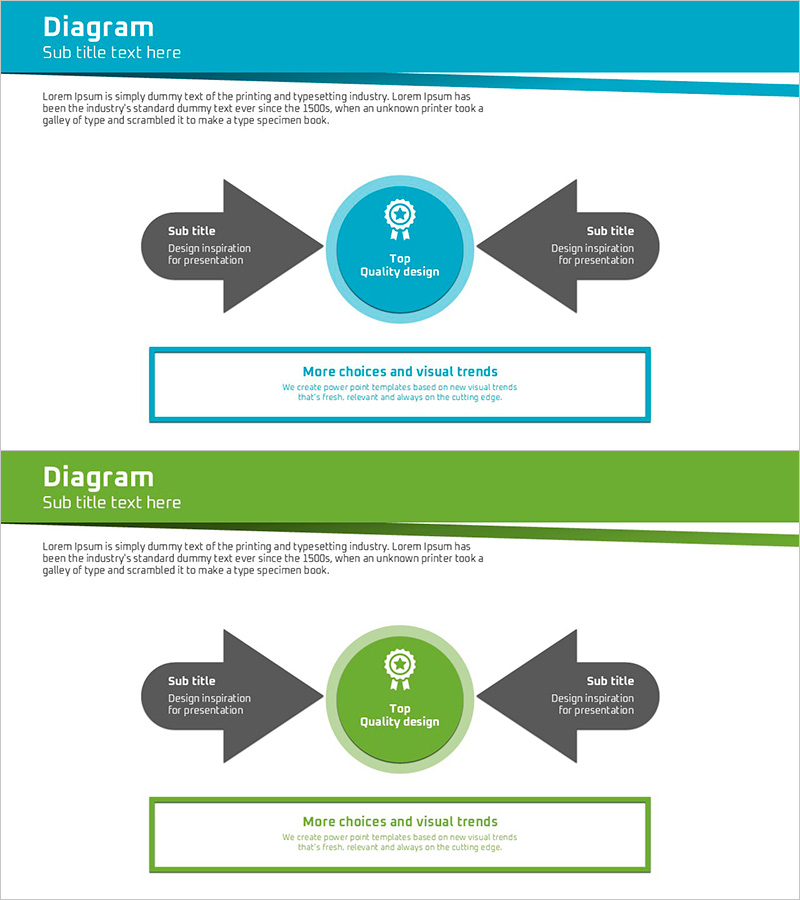
A 2-slide flow diagram PowerPoint template designed to visualize business strategy and quality assurance. The layout features a central turquoise circular icon with symmetrical bidirectional arrows extending left and right, emphasizing the interaction and balance between two key elements. Dark gray speech bubbles at each arrow endpoint provide space for detailed content input, while a turquoise-bordered box at the bottom accommodates additional explanations or key messages. This presentation template is ready to use in business proposals, strategic plans, reports, and corporate presentations.
Usage Points
-
Main Usage
Optimized to visually represent the interaction and balance between key elements of business strategy. The central turquoise icon and bidirectional arrow structure clearly convey the connection between two major concepts or processes, effectively expressing themes such as quality assurance, mutual cooperation, and two-way communication.
-
How to Use
Enter the core concept (e.g., Quality Design, Business Objective) in the central turquoise circle, and add detailed content (e.g., Design Inspiration, Presentation Strategy) in the dark gray speech bubbles at each arrow endpoint. Use the bottom turquoise box for additional explanations or slogans to reinforce your message.
-
Recommended For
Ideal for executive presentations, business strategy pitches, quality management explanations, organizational collaboration structures, investor pitches, and marketing strategy meetings. Particularly suited for business presentations that need to emphasize two complementary elements or bidirectional processes.
-
Slide Structure
Consists of 2 slides with identical layouts. Each slide contains a central turquoise circle (1 text input area) + left dark gray arrow speech bubble (1 area) + right dark gray arrow speech bubble (1 area) + bottom turquoise-bordered box (1 area) = 4 total text input areas per slide.
Related Products
-

Launch Strategy Overlay Linear Diagram - Visualizing Business Strategy
#Business Vision and Strategy #Marketing Plan and Strategy #Diagram
-

Black Friday Main Objective and Strategy Slide
#Business Vision and Strategy #Diagram #Business Strategy
-

Presentation Slide for Differentiated Marketing Launch Strategy
#Business Vision and Strategy #Marketing Plan and Strategy #Diagram
-

Animal Nature Business Strategy Flow – Vision Responding to Environmental Changes
#Business Vision and Strategy #Business Strategy #Diagram
