Business Forest Wide Template Pie Chart – Visualization of Data
RJ0200026_11
- Last Update 04/04/2025
- File Size 0.2MB
- # of Slides 2
- File Format PPTX
- Slide Ratio 16:9
- Color
Keywords
About the Product
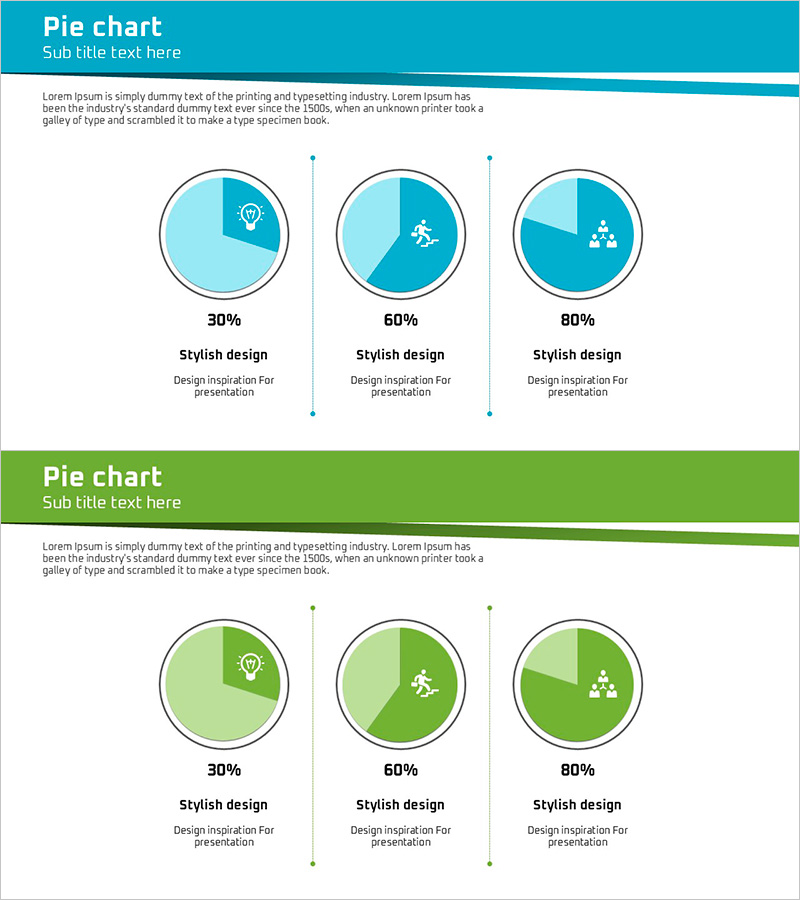
A professional pie chart PowerPoint slide designed to clearly visualize data composition and proportions in business presentations. This 2-slide deck features a teal and green dual-tone color scheme with three circular pie charts on each slide, representing 30%, 60%, and 80% ratios respectively. Each chart includes an icon (lightbulb, runner, organizational chart) and text fields below for customizable labels and descriptions, making it ideal for presenting product features, marketing strategies, organizational structures, and other business metrics. Available in 16:9 widescreen PPTX format, fully editable and ready for immediate use in company presentations, business plans, marketing proposals, and investor pitches.
Usage Points
-
Main Usage
Visually emphasize data composition, proportions, and key metrics in corporate presentations. Effectively communicate product feature comparisons, marketing channel distribution, organizational structure ratios, market share percentages, and other quantitative business indicators at a glance.
-
How to Use
Insert into company profile presentations (business overview section), business plans (strategy development), marketing proposals (channel analysis), and investor presentations. Customize by editing text labels below each chart and replacing icons as needed to match your specific content and branding.
-
Recommended For
Executive presentations, investor relations (IR) meetings, employee onboarding materials, and client proposal documents. Particularly effective for business presentations requiring emphasis on quantitative data and numerical comparisons to establish credibility and clarity.
-
Slide Structure
2-slide layout with 3 pie charts horizontally arranged on each slide, each displaying different proportions (30%, 60%, 80%). Each chart includes an icon at the top and customizable title and description text fields below for adding data labels and explanations.
Related Products
-

Market Analysis and Market Share Pie Chart – Capturing Success Through Data Visualization
#Market and Competitor Analysis #Diagram #Graph
-

Modern Business Plan Template – Visualizing Revenue Projections
#Product/Service Introduction #Business Strategy #Graph
-

Triangle Pattern Template with Hexagon Pie Chart
#Product/Service Introduction #Business Management #Diagram
-

Market Analysis with Five Color Pie Charts – Stylish Design
#Market and Competitor Analysis #Financial Plans and Performance #Graph
