Online Presentation Template Mockup & Chart – Digital Marketing Strategy
RJ0200025_30
- Last Update 04/04/2025
- File Size 3.6MB
- # of Slides 2
- File Format PPTX
- Slide Ratio 16:9
- Color
Keywords
- #Content-Based Slides
- #Design-Based Slides
- #Marketing Plan and Strategy
- #Graph
- #Other
- #Other
- #Radar Chart Spider Chart
- #Mockup
- #16:9
- #desktop mockup PowerPoint slide
- #radial chart template
- #digital marketing presentation
- #monitor mockup slide
- #marketing performance chart PowerPoint
- #how to create radial chart in PowerPoint
About the Product
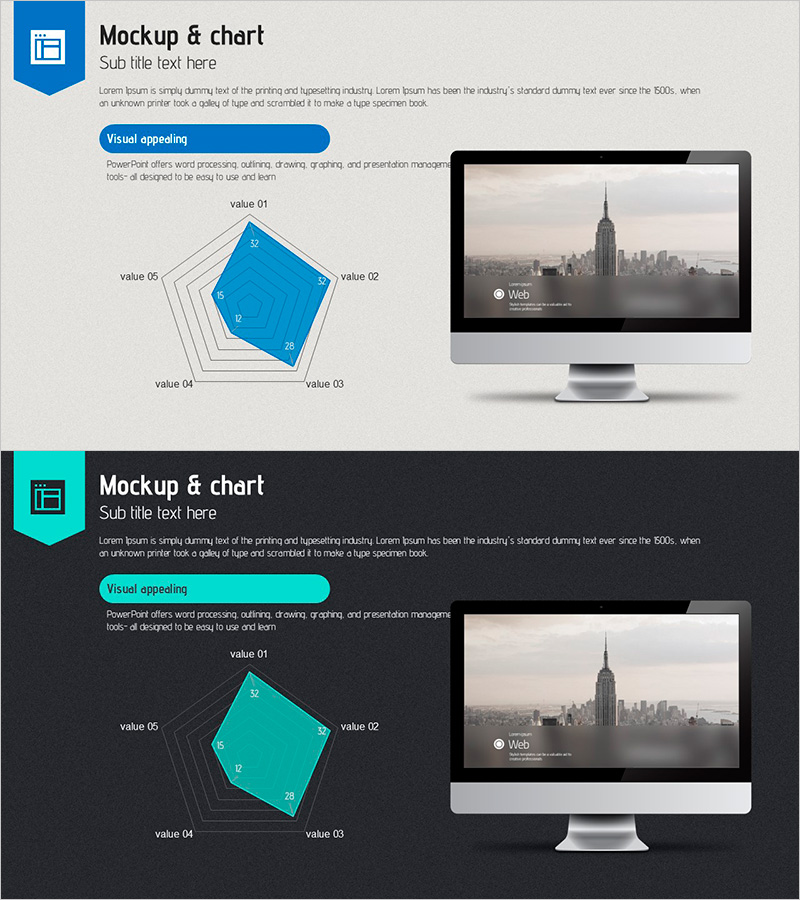
A 2-slide PowerPoint presentation designed for digital marketing strategy presentations. The first slide features a desktop monitor mockup where you can insert website screenshots or dashboard interfaces, while the second slide displays a 5-point radial chart for visualizing marketing performance metrics. The blue gradient and white background combination ensures excellent data readability and modern visual appeal in 16:9 widescreen format. Both slides have clearly defined text and image areas for immediate editing, making them ideal for marketing team performance reports, digital strategy proposals, online campaign analysis, and executive dashboards.
Usage Points
-
Main Usage
Combines a desktop monitor mockup for displaying website or dashboard interfaces with a 5-point radial chart for comparing marketing performance metrics, enabling comprehensive communication of digital strategy execution and key performance indicators in a single presentation.
-
How to Use
Insert actual website screenshots or app UI images into the monitor mockup area on slide 1, then populate the radial chart on slide 2 with marketing channel performance data (visitors, conversion rate, engagement, clicks, revenue) to report strategy implementation status and results.
-
Recommended For
Marketing team monthly and quarterly performance reports, digital marketing strategy proposal presentations, online campaign analysis meetings, website improvement project status updates, executive-level digital performance briefings, and stakeholder communication on marketing ROI.
-
Slide Structure
Slide 1: Desktop monitor mockup (image insertion area) with title and description text / Slide 2: 5-point radial chart (labeled value 01–05) with title and description text. Blue gradient background with white borders emphasizes data visualization.
Related Products
-

Benefits of Smart Device Learning – Innovative Marketing Strategy
#Technical Approach #Marketing Plan and Strategy #Other
-

Typographic Wide Template Mockup – Templates for Efficient Marketing Strategies
#Marketing Plan and Strategy #Text Box #Other
-

Price and Promotion Strategies Slide – Dynamic Flow Diagram Design
#Marketing Plan and Strategy #Diagram #Other
-

Fund Planning Radar Chart – Strategic Visualization
#Product/Service Introduction #Marketing Plan and Strategy #Graph
