Rainbow Paper Presentation Template - Infographic Elements
RJ0200024_7
- Last Update 04/04/2025
- File Size 5.1MB
- # of Slides 2
- File Format PPTX
- Slide Ratio 16:9
- Color
Keywords
About the Product
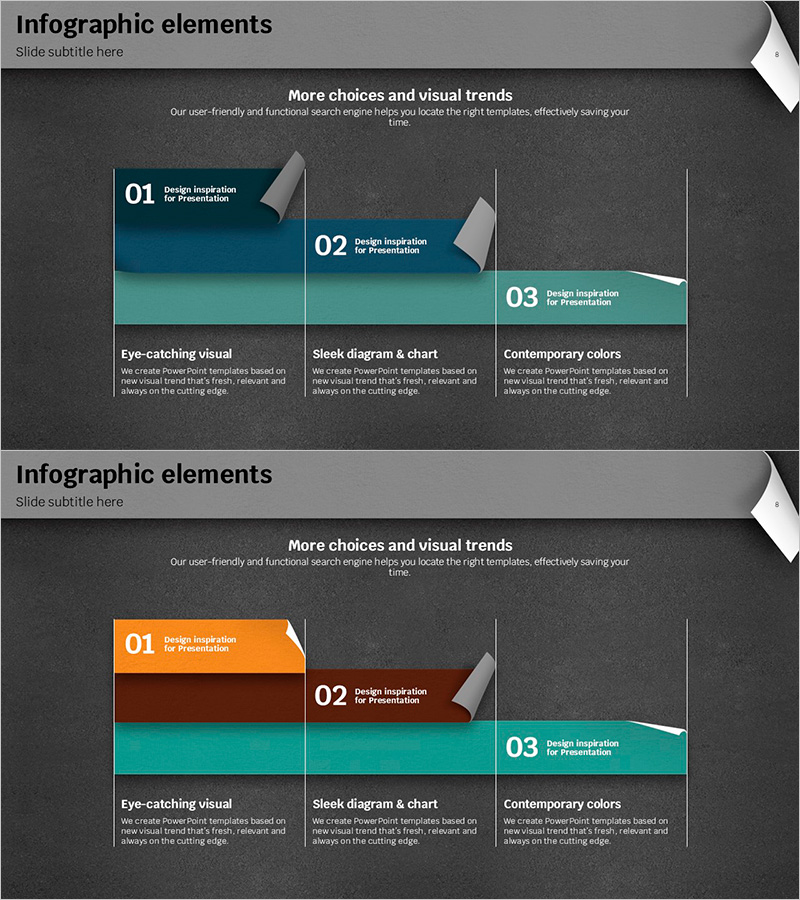
A 3-step process infographic PowerPoint slide designed to visualize business strategy and operational planning. The slide features a dark gray background with three color-coded blocks in teal, orange, and navy blue, each representing a distinct phase. Every step includes dedicated title and description text areas for clear information hierarchy. This 16:9 widescreen PPTX template with 2 slides is ready to use in strategy sections, implementation plans, and operational process presentations. The horizontal timeline structure effectively communicates sequential phases, decision flows, and project milestones.
Usage Points
-
Main Usage
This slide visually represents business strategy and operational planning through a 3-phase process structure. The horizontal timeline layout clearly communicates sequential workflow, project milestones, and decision stages. Color differentiation helps audiences instantly recognize each phase's role and importance in the overall plan.
-
How to Use
Enter phase names (e.g., Planning, Execution, Evaluation) in the title area of each block, then add detailed descriptions and responsible departments in the text sections below. Colors can remain as designed or be customized to match your organization's branding. Adjust font sizes based on content length to maintain readability.
-
Recommended For
Ideal for business plans, marketing proposals, pitch decks, and investor presentations—particularly in strategy, implementation, and operational sections. Highly effective for project management timelines, organizational restructuring, new product launches, and marketing campaign schedules.
-
Slide Structure
2-slide set featuring the first slide with navy, teal, and orange 3-step blocks, and the second slide with orange, burgundy, and teal blocks. Each block contains one title input field and one description text area, providing 6 total text entry points across both slides.
Related Products
-

3D Diagram of the 3-Step Process
#Business Strategy #Operational Plan #Diagram
-

Game Business Process Diagram - Visualization of Business Strategy
#Business Strategy #Operational Plan #Diagram
-

Process for Effective Marketing – Business Execution Strategy
#Business Strategy #Operational Plan #Diagram
-

Visualizing the IoT Service Process – Incorporating Business Strategy
#Business Strategy #Operational Plan #Diagram
