Rainbow Presentation Template Infographic Elements – Visualizing Time Flow
RJ0200022_4
- Last Update 04/03/2025
- File Size 3.8MB
- # of Slides 2
- File Format PPTX
- Slide Ratio 16:9
- Color
Keywords
About the Product
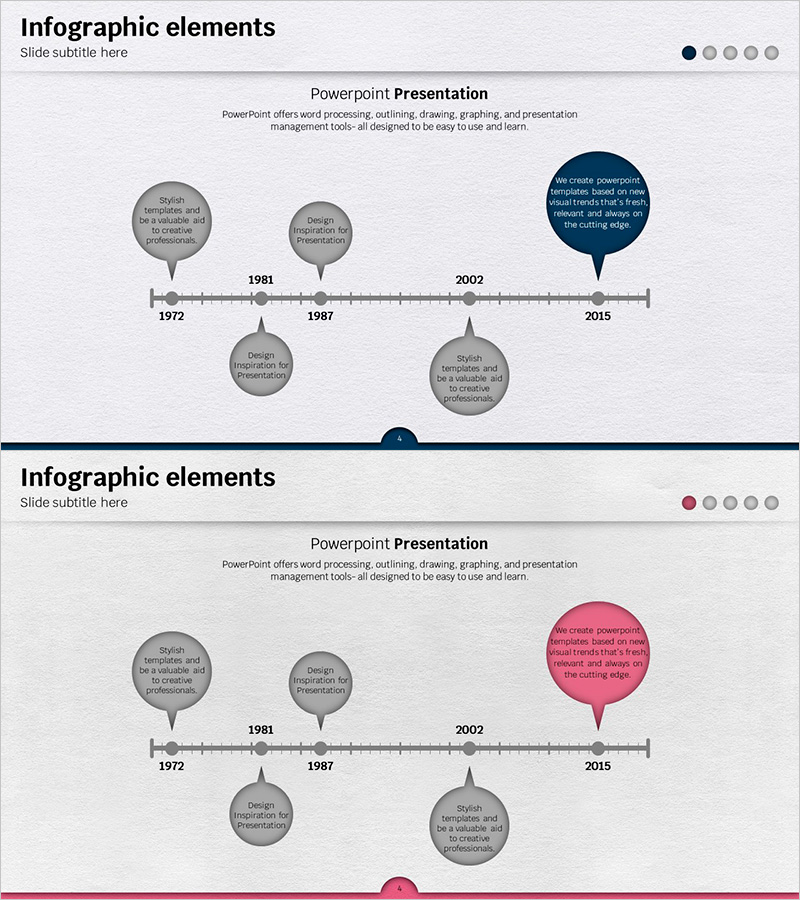
A horizontal timeline diagram PowerPoint slide designed to visualize company history, product development milestones, and key achievements over time. Five circular nodes are positioned along a linear timeline with connected speech bubble callouts for detailed information at each milestone. Available in three color themes—dark blue, gray, and pink—each node features an independent text input area for flexible customization. This 2-slide presentation template is ready to use immediately for corporate introductions, business reports, and investor presentations.
Usage Points
-
Main Usage
Present company milestones, product development phases, or organizational growth in chronological order. The five-node timeline with callout bubbles clearly communicates key events and achievements, making complex historical information easy for audiences to follow and retain.
-
How to Use
Enter years, events, and achievements into each of the five nodes along the horizontal timeline. Add detailed descriptions in the connected speech bubble callouts. Select your preferred color theme (dark blue, gray, or pink) to match your presentation tone. Use in company overview sections, business reports, investor pitch decks, and organizational history presentations.
-
Recommended For
Executives and marketing teams presenting company history, product managers visualizing development roadmaps, startup founders highlighting growth stories, educators explaining historical timelines, HR professionals showcasing organizational milestones, and consultants presenting client case studies or project phases.
-
Slide Structure
2-slide set with horizontal linear timeline as the central element. Five circular nodes (approximately 60px diameter) are evenly spaced along the timeline. Each node connects to a speech bubble callout (approximately 150×80px) positioned above or below. Timeline line is gray, nodes are gray or accent color (dark blue or pink), callout boxes have white background with black text.
Related Products
-

Water Resources History Presentation Template
#Company Introduction #Business Strategy #Diagram
-

Business Step-by-Step History Diagram – Systematic Flow and Clear Information Delivery
#Company Introduction #Diagram #History
-

Simple PowerPoint Wide Template History
#Company Introduction #Diagram #History
-

Infinite Energy Wide PPT History – The Trajectory of Corporate Growth
#Company Introduction #Business Strategy #Diagram
