Leather Material Bilateral Bar Graph Template – Visual Enhancement for Marketing Strategy
RJ0200021_12
- Last Update 04/03/2025
- File Size 6.2MB
- # of Slides 2
- File Format PPTX
- Slide Ratio 16:9
- Color
Keywords
- #Content-Based Slides
- #Design-Based Slides
- #Business Introduction
- #Marketing Plan and Strategy
- #Graph
- #Revenue Model
- #Marketing Strategy
- #Horizontal Bar
- #Double Horizontal Bar
- #16:9
- #horizontal bar chart PowerPoint
- #bar graph slide template
- #data comparison chart
- #marketing analysis PPT
- #leather texture presentation template
About the Product
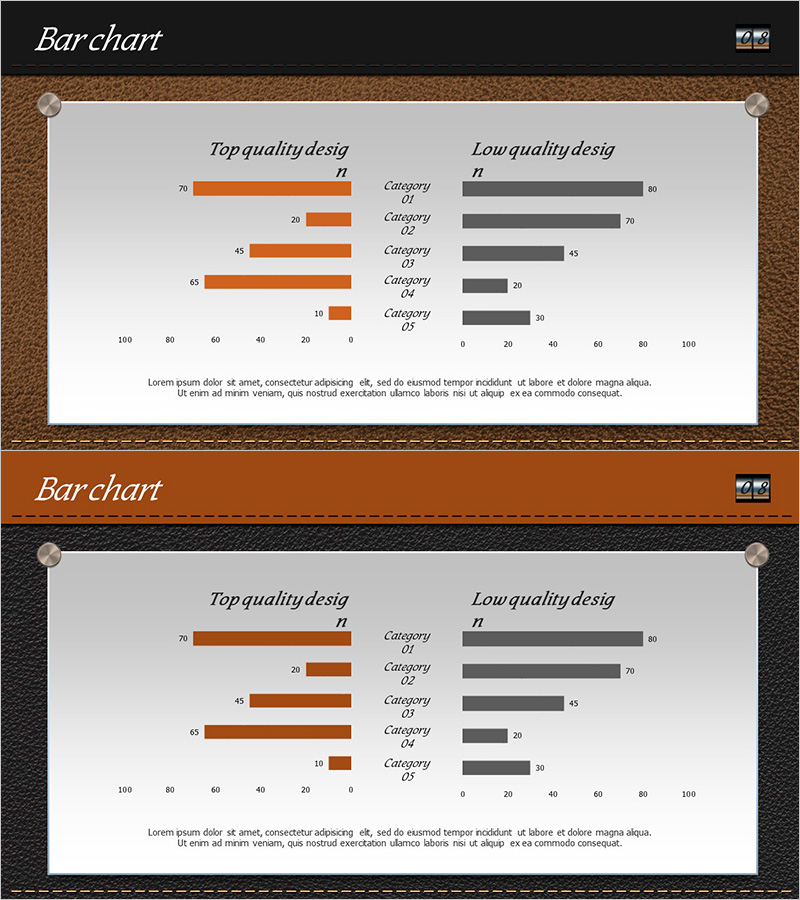
A horizontal bar chart PowerPoint slide optimized for marketing strategy and business performance analysis. The slide features a brown leather texture background with orange and gray contrasting bars arranged in a bilateral comparison layout. The left section displays 'Top quality design' while the right section shows 'Low quality design,' enabling side-by-side data comparison across five categories. This slide deck is ideal for competitive analysis, performance metrics visualization, and marketing effectiveness measurement in presentations. Provided as a 2-slide set in 16:9 widescreen format with fully editable colors and numerical values.
Usage Points
-
Main Usage
Visualize quantitative data during marketing strategy development and performance analysis phases, including competitive benchmarking, market indicator analysis, and product performance evaluation. The bilateral layout clearly contrasts 'strengths' against 'areas for improvement' or competing metrics.
-
How to Use
Replace the five category labels and numerical values with your own marketing metrics. Assign the orange bars to represent top-performing data and gray bars for comparison targets, then insert into executive reports, marketing plans, or business proposals.
-
Recommended For
Marketing managers, business planners, sales directors, and executive reporting teams benefit most from this template. Particularly effective for quarterly performance reviews, marketing campaign ROI measurement, and competitive benchmarking documentation.
-
Slide Structure
Two-slide set with bilateral horizontal bar charts on each slide. Five categories displayed with orange bars (0–100 scale) on the left and gray bars (0–100 scale) on the right, category names centered between them. Brown leather texture background frames the entire slide composition.
Related Products
-

Mobile Service Revenue Model Diagram – Integrated Business Strategy and Marketing
#Business Introduction #Marketing Plan and Strategy #Diagram
-

Plotting Paper Presentation Template Bilateral Bar Graph – The Perfect Choice for Market Analysis
#Market and Competitor Analysis #Marketing Plan and Strategy #Graph
-

Horizontal Bar Chart Comparison – Presenting Effective Marketing Strategies
#Market and Competitor Analysis #Marketing Plan and Strategy #Graph
-

Marketing Plan Diagram for Visualizing Marketing Strategy
#Business Strategy #Marketing Plan and Strategy #Diagram
