Golden Circle Cluster Inclusion Diagram – Integrated Visualization of Business Areas
RJ0200019_7
- Last Update 04/02/2025
- File Size 7.2MB
- # of Slides 2
- File Format PPTX
- Slide Ratio 16:9
- Color
Keywords
- #Content-Based Slides
- #Design-Based Slides
- #Business Introduction
- #Diagram
- #Business Areas
- #Flow
- #Cluster
- #Multidirectional Flow
- #Inclusive Cluster Diagram
- #16:9
- #Golden Circle diagram PowerPoint
- #inclusion diagram slide
- #concentric cluster visualization
- #business area diagram PPT
- #hierarchical structure PowerPoint template
About the Product
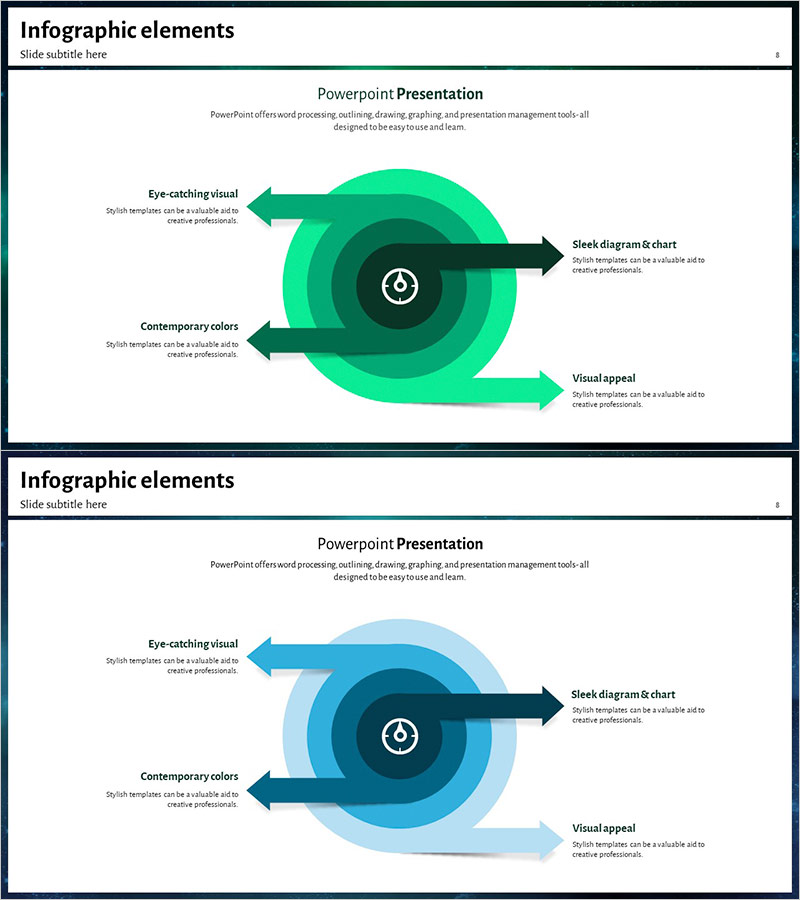
A PowerPoint slide expressing the Golden Circle concept as a 3-layer concentric inclusion diagram. Centered on a clock icon, mint-green gradient circular layers expand outward, with left and right arrows connecting four key elements (Eye-catching visual, Sleek diagram & chart, Contemporary colors, Visual appeal). Ideal for visualizing integrated business areas or expressing organizational core values and surrounding functions hierarchically. The presentation includes 2 slides with mint-green and blue color versions, optimized for 16:9 widescreen format. Fully editable for customization to your specific business context and messaging needs.
Usage Points
-
Main Usage
Visualizes hierarchical relationships between organizational core values and surrounding functions, or expresses integrated business area connections. The center-to-periphery structure clearly communicates the hierarchy between core messages and supporting elements, making complex organizational concepts immediately understandable.
-
How to Use
Apply to company profile presentations explaining business areas, strategic planning presentations highlighting core values, and organizational structure slides. Edit the central icon and text labels to customize for your organization's core concept and functions. Adjust arrow directions and layer count to accommodate various hierarchical structures and data relationships.
-
Recommended For
Executives and planning teams explaining business strategy, HR and organizational development teams introducing organizational structure and functions, marketing and product teams expressing product/service core values and detailed features, startup and venture representatives emphasizing business area integration in investor pitch presentations.
-
Slide Structure
A clock icon at center with 3 concentric circular layers in gradient effect. Four text boxes connect via 3 left-side and 1 right-side arrows. Slide 1 features mint-green tones; Slide 2 offers blue tones with identical structure, allowing color selection based on presentation context and brand guidelines.
Related Products
-

Arrow Circle Diagram – Visualizing Business Management and Execution Plans
#Business Management #Diagram #Execution Plan
-

Diagram of the Medical Business Sector
#Company Introduction #Business Introduction #Diagram
-

Visualizing Business Activities – Innovative Components
#Product/Service Introduction #Business Introduction #Diagram
-

Paint Splash Template – Diagram and Business Overview
#Business Introduction #Business Vision and Strategy #Diagram
