Cluster Connection Triangle Diagram – Visualizing Business Areas
RJ0200019_5
- Last Update 04/02/2025
- File Size 7.2MB
- # of Slides 2
- File Format PPTX
- Slide Ratio 16:9
- Color
Keywords
About the Product
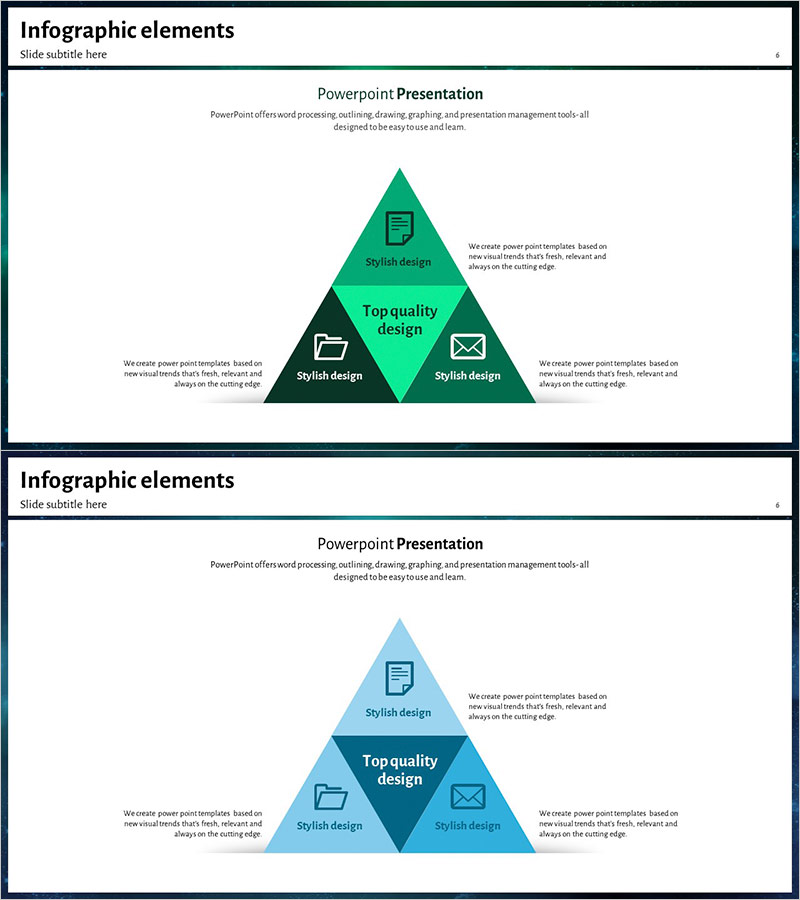
A cluster connection triangle diagram PowerPoint slide that visualizes the relationship between three business areas using a triangular structure. Featuring a two-tone color scheme of green and black, it connects a central core concept with left and right side elements hierarchically, with icons and text fields in each section for business domains, strategic elements, and organizational structures. The 2-slide set offers multiple color combinations (green and blue) and is optimized for 16:9 widescreen format, ready for immediate use in corporate presentations, strategy meetings, and business planning presentations.
Usage Points
-
Main Usage
Expresses the relationship and hierarchy between three organizational, strategic, or business elements at a glance. With a central core concept connected to left and right side elements, it clearly communicates business models, management strategies, organizational composition, and market analysis involving three-axis interaction.
-
How to Use
Enter business domain names, strategy items, or department names in each triangle section's text area and customize by replacing icons. Emphasize key messages in the central 'core concept' area and arrange detailed content on the left and right sides to complete a hierarchical information structure.
-
Recommended For
Executives, strategy managers, and business development teams use this when explaining management strategies, business portfolios, and organizational structures. Ideal for investment pitch presentations, business plan reports, organizational restructuring announcements, and marketing strategy sessions where three-axis balance must be emphasized.
-
Slide Structure
2-slide set. Each slide features a green triangle at the top center (core concept), a black triangle in the middle (main items), and green triangles on left and right sides (detailed elements) forming a 3-node cluster connection structure. The first slide uses green and black tones; the second provides a blue and black color variation.
Related Products
-

Entertainment Business Sector Diagram – Cluster Design
#Company Introduction #Business Introduction #Diagram
-

Heart Drop Shape Connection Diagram – True Connections in Business
#Company Introduction #Product/Service Introduction #Diagram
-

Planetary Graphic Diagram – Visualized Business Domains
#Company Introduction #Business Introduction #Diagram
-

Astronomy Research Core Areas Diagram – Vision and Strategy of the Business
#Company Introduction #Business Vision and Strategy #Diagram
