Visualization of Technology Business Fields and Areas – The Harmony of Yellow and Red
RJ0400027_6
- Last Update 05/25/2025
- File Size 2MB
- # of Slides 2
- File Format PPTX
- Slide Ratio 16:9
- Color
Keywords
- #Content-Based Slides
- #Design-Based Slides
- #Company Introduction
- #Business Introduction
- #Diagram
- #Business Areas
- #Business Areas
- #Cluster
- #Chain Diagram
- #16:9
- #connected cluster diagram PowerPoint
- #3-node relationship diagram slide
- #technology field visualization PPT
- #business area diagram template
- #how to create cluster diagram in PowerPoint
About the Product
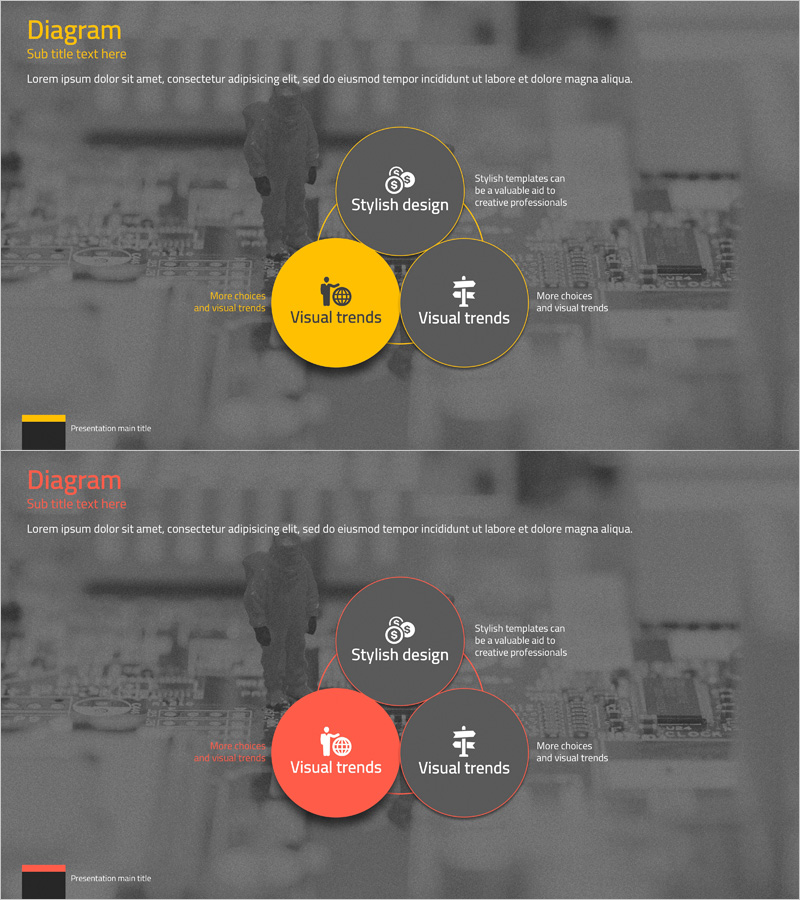
A connected cluster diagram PowerPoint slide that visualizes technology business fields and areas using three circular nodes. The central yellow circle represents the core concept, while the side gray circles represent related domains, illustrating hierarchical relationships and interconnections. Text callouts can be added between nodes to provide explanations, making it ideal for business presentations covering technology field classification, business area segmentation, and strategic positioning. This 16:9 widescreen 2-slide set is ready for immediate editing and customization.
Usage Points
-
Main Usage
Visually express the hierarchical relationships and interconnections between core technology business fields and related domains. By centering the main concept in the central node and connecting surrounding areas, it effectively communicates business portfolios, technology ecosystems, and strategic positioning to stakeholders.
-
How to Use
Enter the core concept (e.g., Visual trends) in the central yellow circle and related domains (e.g., Stylish design, Visual trends) in the side gray circles. Use connecting lines and text callouts between nodes to add descriptions and interactions for each domain. Colors and text are fully editable to match your presentation theme.
-
Recommended For
Ideal for technology company business overviews, IT consulting proposals, startup investment pitch decks, product portfolio introductions, organizational structure explanations, and marketing strategy presentations. Recommended for executive teams, planning departments, marketing teams, and sales teams in strategic meetings and external presentations.
-
Slide Structure
2-slide set featuring identical 3-node connected cluster diagrams in two color variations: yellow-gray and red-gray dual tones. Each slide contains 3 circular nodes (1 large center, 2 medium sides), circular borders, connecting lines, and 4 text callout areas for flexible information placement.
Related Products
-

Business Area Overlay Diagram – A Blend of Visual Appeal and Functionality
#Company Introduction #Business Introduction #Diagram
-

Mobile Security Service Diagram
#Company Introduction #Business Introduction #Diagram
-

Pentagonal Star Diagram – Cluster for Business Introduction
#Company Introduction #Business Introduction #Diagram
-

Fountain Pen Business Area Diagram – Visualized Cluster Structure
#Company Introduction #Business Introduction #Diagram
