Volume PowerPoint Template to Visualize History in Linear Flow
RJ0200017_4
- Last Update 04/02/2025
- File Size 3.1MB
- # of Slides 2
- File Format PPTX
- Slide Ratio 16:9
- Color
Keywords
- #Content-Based Slides
- #Design-Based Slides
- #Company Introduction
- #Diagram
- #History
- #Flow
- #Linear Flow
- #16:9
- #linear timeline diagram PowerPoint
- #company history visualization slide
- #4-point flow diagram
- #timeline PPT template
- #how to create timeline in PowerPoint
- #history presentation slide download
About the Product
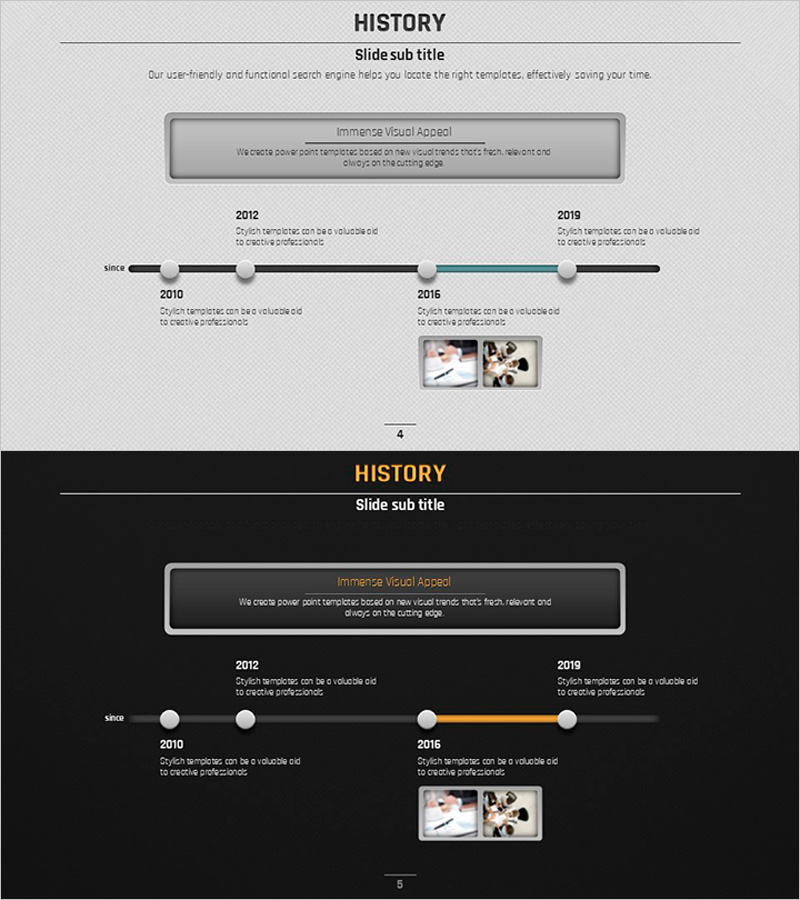
A PowerPoint slide set that visualizes company milestones and historical development in a linear timeline format. The 2-slide template features a light gray background with a black horizontal timeline axis, circular nodes, and orange accent points to clearly convey chronological progression. Four time points (2012, 2010, 2016, 2019) can be positioned along the timeline, with dedicated text description areas and image insertion zones beneath each node. This PPT template is ideal for presenting company growth trajectories, product development histories, and organizational evolution in business presentations, investor pitches, and corporate introductions.
Usage Points
-
Main Usage
Designed to present company history, product development timelines, and organizational growth stages in chronological order. The linear timeline axis with four key milestone nodes enables clear, logical visualization of progression from past to present.
-
How to Use
Use in company introduction presentations (history section), investor pitch decks (background and growth narrative), and product launch events (development journey). Simply input text at each year node and insert relevant photos or product images in the designated image zones.
-
Recommended For
Ideal for corporate executives, marketing professionals, and product teams preparing external presentations. Particularly effective for startups sharing growth stories, enterprises highlighting major milestones, and teams explaining product evolution or organizational development.
-
Slide Structure
Two-slide set with horizontal black timeline axis as the central element. Four circular nodes (2012, 2010, 2016, 2019) are positioned along the axis with text description areas above and below, plus image insertion zones. The 2016 node is highlighted in orange to emphasize a key milestone point.
Related Products
-

Simple PowerPoint Wide Template History
#Company Introduction #Diagram #History
-

Water Resources History Presentation Template
#Company Introduction #Business Strategy #Diagram
-

Social Network Wide Template Progress Diagram
#Company Introduction #Diagram #Text Box
-

Green & Gray Template Wide History
#Company Introduction #Business Strategy #Diagram
