Simple Circle Presentation Template Diagram – Visualizing Business Strategy
RJ0200013_30
- Last Update 04/01/2025
- File Size 0.4MB
- # of Slides 2
- File Format PPTX
- Slide Ratio 16:9
- Color
Keywords
- #Content-Based Slides
- #Design-Based Slides
- #Business Strategy
- #Diagram
- #Step-by-Step Schedule Plan
- #Implementation Framework
- #Spread
- #Centralized Diagram
- #16:9
- #circular diagram PowerPoint
- #5-step radial diagram
- #business strategy presentation slide
- #central node diagram template
- #process flow PPT slide
About the Product
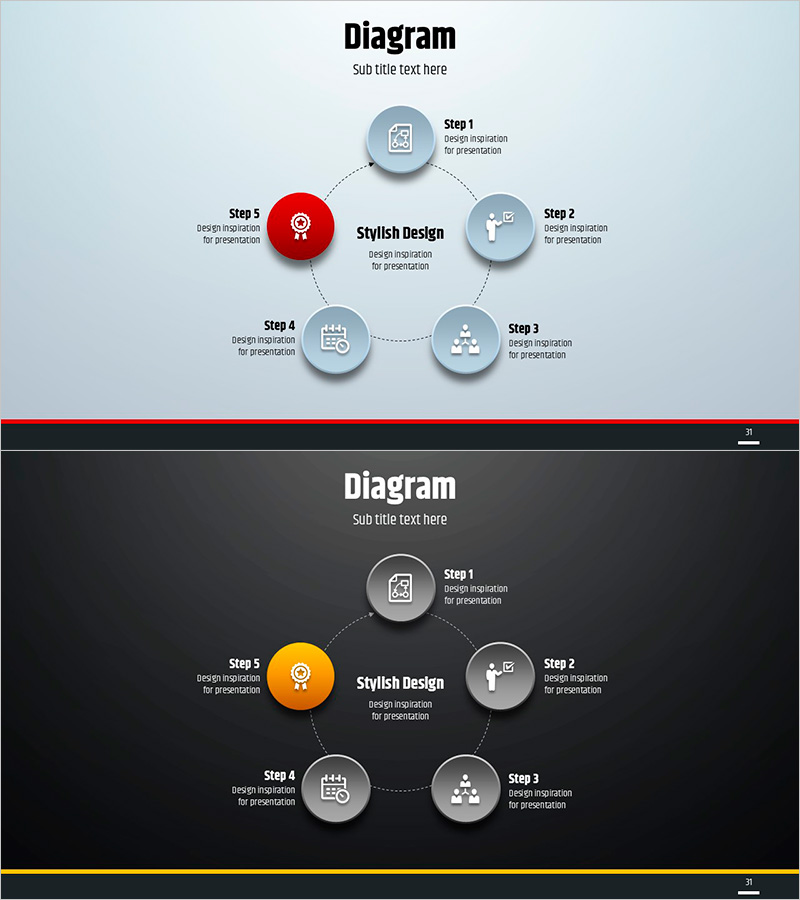
A radial diagram PowerPoint slide with five steps arranged in a circular pattern around a central concept. The design features light gray and dark backgrounds with blue and red accent nodes, making it ideal for visualizing business strategies, project phases, and cyclical processes. Each step includes an icon and text area for customization, allowing seamless integration into presentations on organizational vision, marketing strategy, operational planning, and more. The 16:9 format includes two slide layouts for flexible presentation flow.
Usage Points
-
Main Usage
Designed to visualize organizational core strategies and five-step cyclical processes. Perfect for business strategy presentations, project management, marketing campaign phases, product development cycles, and operational planning where step-by-step flow visualization is essential.
-
How to Use
Replace the central 'Stylish Design' text with your core concept, then customize each step (Step 1–5) with your organization's content. Two background versions are provided—light and dark—allowing you to match your presentation environment and corporate branding guidelines.
-
Recommended For
Executive reports, business plans, strategy presentations, project kickoff meetings, marketing planning sessions, organizational restructuring explanations, new business initiatives, quality improvement process descriptions, and any presentation requiring emphasis on cyclical or sequential structures across all departments and management levels.
-
Slide Structure
Five circular nodes arranged radially around a central focal point in clockwise order. Each node contains an icon, step label (Step 1–5), and descriptive text area, connected by dotted lines to emphasize the cyclical flow. Two versions are included: light gray background and dark background. The central node is highlighted in red for emphasis.
Related Products
-

Business Procedure Orange Yellow Diagram
#Business Strategy #Diagram #Step-by-Step Schedule Plan
-

Science Experiment Plan Diagram – Step-by-Step Implementation System
#Business Strategy #Diagram #Step-by-Step Schedule Plan
-

Sea Lighthouse Step-by-Step Business Schedule Plan
#Business Strategy #Diagram #Step-by-Step Schedule Plan
-

Management System and Area Charts – Effective Business Strategies
#Business Strategy #Market and Competitor Analysis #Diagram
