System Graphic Diagram – Visualizing Business and Infrastructure Connections
RJ0200012_13
- Last Update 03/31/2025
- File Size 1.3MB
- # of Slides 2
- File Format PPTX
- Slide Ratio 16:9
- Color
Keywords
- #Content-Based Slides
- #Design-Based Slides
- #Product/Service Introduction
- #Business Introduction
- #Diagram
- #Features
- #Infrastructure
- #Spread
- #Decentralized Diagram
- #16:9
- #network diagram PowerPoint
- #radial diagram slide
- #system architecture template
- #business infrastructure visualization
- #connection diagram PPT
- #network structure slide template
About the Product
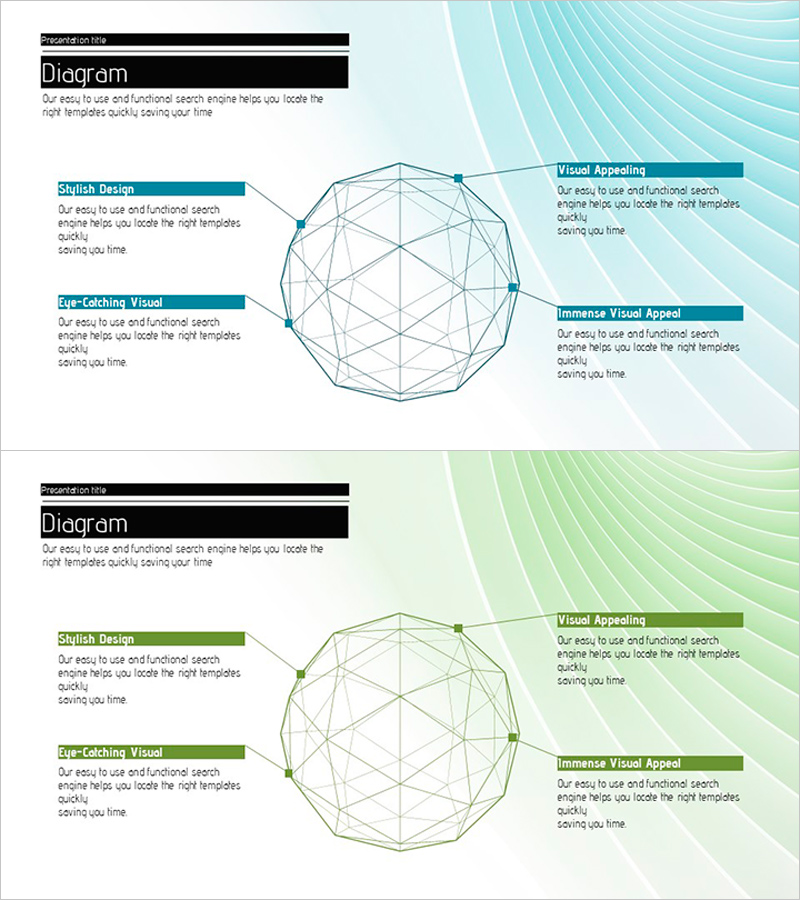
An 8-node radial diagram PowerPoint slide that visualizes complex connections between business and infrastructure elements. The hub-and-spoke structure radiates from a central node to surrounding elements, making it ideal for system architecture, organizational networks, service integration maps, and supply chain diagrams. Designed with light blue and green gradient backgrounds, geometric nodes, and connecting lines that can be customized with text labels. The 2-slide set includes color variations (blue and green tones) for flexible presentation themes. Fully editable PPTX format ready for immediate use.
Usage Points
-
Main Usage
Effectively communicates system architecture, organizational networks, service integration maps, and supply chain structures where information radiates from a central hub. Ideal for explaining complex business processes and technical infrastructure in an intuitive, visually compelling manner.
-
How to Use
Place your core concept (company, system, or service) in the central node and distribute key elements (departments, functions, or connection points) across the 8 surrounding nodes. Customize node colors and sizes, add or remove connecting lines, and adjust text to emphasize information hierarchy.
-
Recommended For
IT and technology presentations, organizational structure explanations, supply chain management reports, digital transformation strategies, network infrastructure overviews, and business ecosystem analyses. Recommended for professionals who need to emphasize system interconnectivity and relationships.
-
Slide Structure
One central primary node surrounded by 8 satellite nodes arranged in a circular pattern, each connected to the center by lines. Background features light blue or green gradient curves creating a contemporary aesthetic. Both slides maintain identical structure with color variations only.
Related Products
-

Visually Appealing Company Introduction PowerPoint Template
#Company Introduction #Product/Service Introduction #Business Vision and Strategy
-

Galaxy Theme Infrastructure Connection Diagram – Cluster for Business Introduction
#Business Introduction #Diagram #Infrastructure
-

Cube Structure Diagram – Effective Product and Service Explanation
#Product/Service Introduction #Technical Approach #Diagram
-

Centerless Diffusion Diagram Using Colored Pencils
#Product/Service Introduction #Diagram #Features
