Color Learning Structure Diagram – Maximizing Learning Impact with Creative Visuals
RB0300009_4
- Last Update 03/09/2025
- File Size 1MB
- # of Slides 2
- File Format PPTX
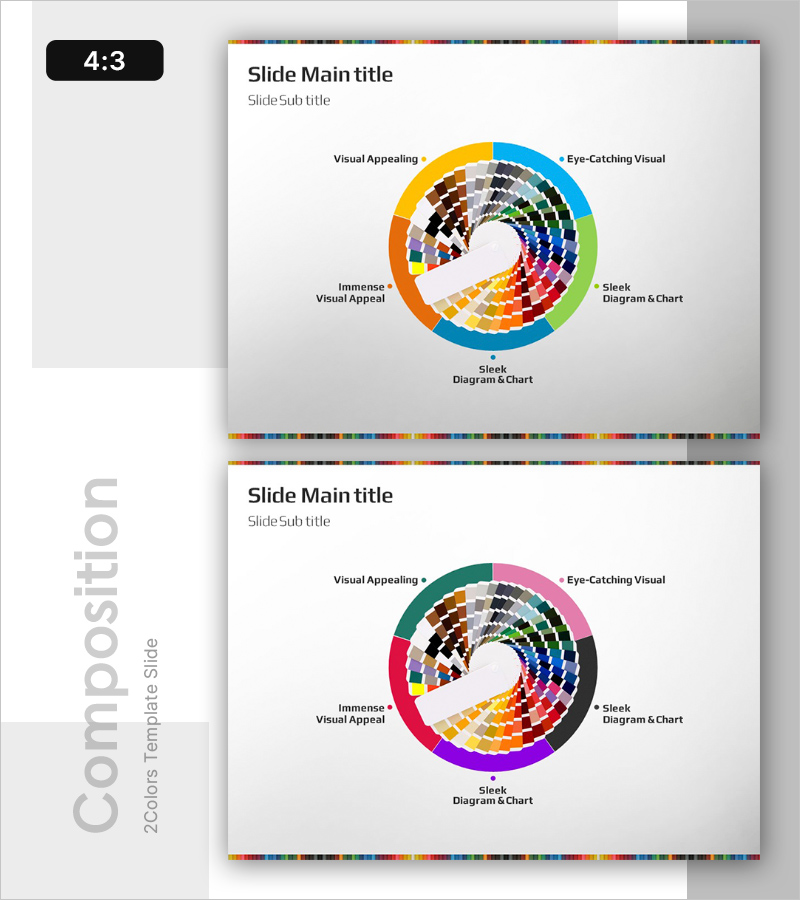
- Slide Ratio 4:3
- Color
Keywords
About the Product
A radial color learning structure diagram PowerPoint slide that expands from center to periphery. This presentation template classifies diverse color palettes—yellow, orange, brown, blue, green, pink, and purple—across 5 concentric layers to illustrate color theory, visual psychology, and learning effectiveness simultaneously. Each color segment includes labels and visual markers to maximize both aesthetic appeal and information clarity. Optimized for explaining color strategies in education, design, and marketing fields, this slide deck is provided in 2 color combination versions for flexible presentation needs.
Usage Points
-
Main Usage
A radial diagram designed to visually explain color theory, color psychology, brand color strategy, and design principles. The center-to-periphery expansion structure conveys logical progression from core concepts to detailed elements, while the multi-layered color palette enhances learning retention and memorability.
-
How to Use
Use this slide in educational seminars, workshops, and training sessions to teach color classification, color harmony, and visual psychology. Ideal for marketing presentations introducing brand color palettes, design projects explaining color selection criteria, and creativity workshops expanding color awareness. Each color segment is editable for custom information input.
-
Recommended For
Educators, trainers, designers, marketers, and creative teams explaining color strategy and visual learning. Recommended for university lectures, corporate training, design workshops, color psychology seminars, and brand guideline presentations where audience comprehension and engagement are priorities.
-
Slide Structure
A center-free radial structure with 5 concentric color layers expanding outward. Each layer represents distinct color families (yellow, orange, brown, blue, green, pink, purple) with labels and directional indicators clarifying each segment's meaning. Two color combination versions enable flexible selection based on presentation context.
Related Products
-

Unlocking Insights with 3D Cubes – Cluster Diagram for Effective Information Delivery
#Product/Service Introduction #Diagram #Features
-

Diagram of Major Course Listings – Emphasizing Educational Value
#Product/Service Introduction #Diagram #Features
-

Two Nested Diagrams – Product Introduction and Composition
#Product/Service Introduction #Diagram #Features
-

Overview of Major Organs and Their Functions – Visualized Infographic
#Product/Service Introduction #Diagram #Other
