Idea Derivation Template – Bilateral Bar Graph
RJ0200002_17
- Last Update 03/29/2025
- File Size 0.7MB
- # of Slides 2
- File Format PPTX
- Slide Ratio 16:9
- Color
Keywords
- #Content-Based Slides
- #Design-Based Slides
- #Market and Competitor Analysis
- #Graph
- #Market Status
- #Competitive Advantage
- #Horizontal Bar
- #Double Horizontal Bar
- #16:9
- #bilateral bar chart PowerPoint
- #left-right comparison slide
- #dual bar graph template
- #competitive analysis PPT
- #how to create comparison chart in PowerPoint
About the Product
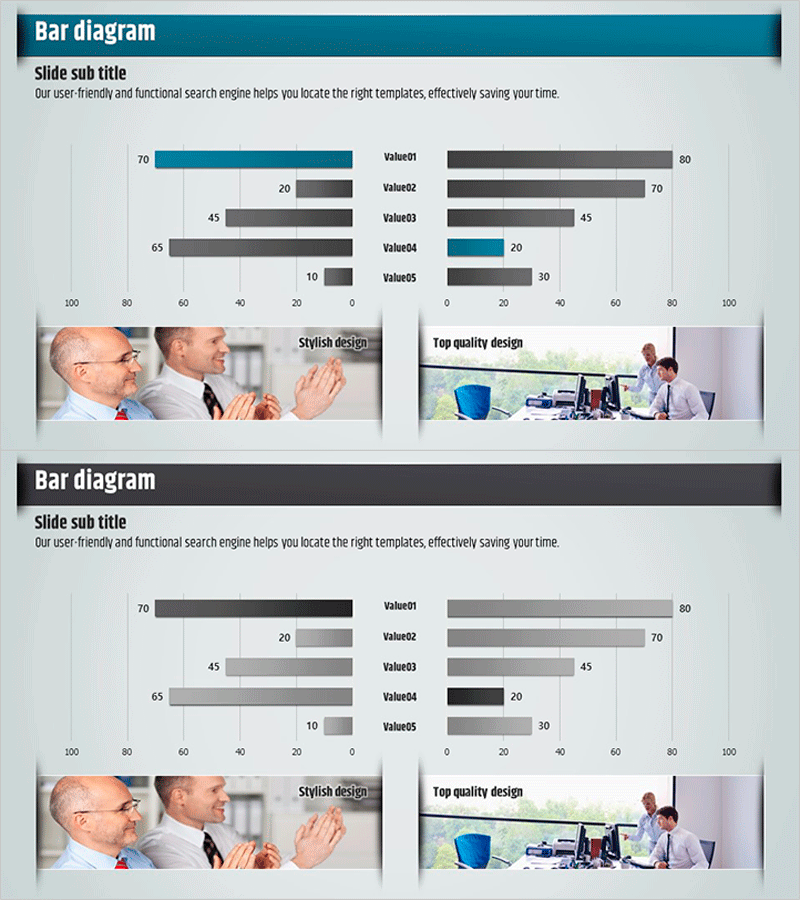
A bilateral bar chart PowerPoint slide with symmetrical left-right layout for comparing two groups of data across five categories. This presentation template uses dark blue and gray tones to display quantitative metrics on a 0–100 scale, making it ideal for business presentations. The dual-bar structure enables clear visualization of competitive advantages, market positioning, or alternative strategy comparisons. Perfect for market analysis, competitor benchmarking, and idea evaluation sessions where two solutions or products need side-by-side assessment. The 16:9 widescreen format includes 2 fully editable slides ready for immediate use.
Usage Points
-
Main Usage
This chart excels at displaying comparative data between two entities or scenarios using a symmetrical left-right layout. Use it to compare your product versus competitors, evaluate two strategic options, benchmark market performance, or present alternative solutions in business proposals, investor pitches, and executive briefings.
-
How to Use
Enter data for the first group (e.g., your company) on the left side and the second group (e.g., competitor) on the right. Normalize values to a 0–100 scale so bar lengths accurately reflect relative performance. Use the dark blue accent color to highlight key differentiators and draw attention to competitive strengths or critical metrics.
-
Recommended For
Marketing professionals, strategy teams, sales executives, and product managers preparing competitive analysis reports, business proposals, and investor presentations. Particularly effective for B2B sales decks, executive summaries, management briefings, and consulting proposals where objective side-by-side comparison of two alternatives is essential.
-
Slide Structure
2-slide deck featuring bilateral bar charts with 5 categories each. Left side displays 5 bars (0–100 scale) for group one; right side mirrors with 5 bars for group two. Title and subtitle areas at top; business photography (2 images) at bottom enhance visual credibility and professional appearance.
Related Products
-

Market and Competitor Analysis PowerPoint Template
#Market and Competitor Analysis #Graph #Market Status
-

Company Two-Way Horizontal Bar Graph – Competitive Advantage Analysis
#Market and Competitor Analysis #Graph #Market Status
-

Current Status as Seen in a Donut Chart – Slide Representing Competitive Advantage
#Market and Competitor Analysis #Graph #Market Status
-

Real Estate Interactive Horizontal Bar Graph – Market Analysis and Performance
#Market and Competitor Analysis #Financial Plans and Performance #Graph
